
The Commodity Futures Trading Commission (CFTC) publishes a weekly report which breaks down the total open interest as of each Tuesday’s settlement for markets in which 20 or more traders hold positions equal to or above reporting thresholds established by the Commission. The reports are released every Friday and provide market participants insight on how open interest is distributed among different groups of traders. In a very general sense, it breaks open interest down into two categories – reportable versus non-reportable positions – but other classifications have been distinguished by the CFTC to provide further insight on the participation of different type of traders in the market.
History and Breakdown of the Reports
Antecedents of the Commitments of Traders (COT) reports can be traced all the way back to 1924 when the USDA’s Grain Futures Administration, the predecessor to the USDA’s Commodity Exchange Authority and later the CFTC, published its first comprehensive annual report of hedging and speculation in regulated futures markets. Beginning in 1962, the reports were published monthly followed by a mid-month and month-end version in 1990, then every two weeks in 1992, and finally a weekly format in 2000. The data is also now compiled and released on a more timely basis, and has since moved from a fee-based subscription to becoming freely available on the CFTC’s website at the following link: https://www.cftc.gov/MarketReports/CommitmentsofTraders/index.htm
The CFTC collects position data from reporting firms including clearing members, futures commission merchants (FCM’S), foreign brokers and exchanges. While the position data is collected by these various reporting firms, the actual category or classification of traders’ predominant business purpose is self-reported by the individual traders on the CFTC’s Form 40 which is reviewed by commission staff for reasonableness and accuracy. Traders are able to report business purpose by commodity, and therefore may be classified differently for one market versus another.
There are four reports, including legacy, supplemental, disaggregated, and traders in financial futures. The legacy reports are broken down by exchange and include a futures only and a combined futures and options report. Legacy reports break down the open interest into two categories – non-commercial and commercial traders. Supplemental reports break down the reportable open interest into three trader classifications: non-commercial, commercial and index traders. The index trader classification was added in 2007 to provide the marketplace with more transparency on positions in exchange-traded markets, with further classifications subsequently added with the disaggregated report in 2009.
The disaggregated report increased transparency by separating traders into the following four reportable categories: Producer/Merchant/Processor/User, Swap Dealers, Managed Money, and Other Reportable. This development evolved from confusion over what types of traders were holding various positions in the markets. Generally speaking, the legacy form of the report which only defines two categories of traders as commercial or non-commercial were historically seen as hedgers and speculators, respectively. Traditionally, these participants were viewed as those whose positions were tied directly to the physical commodity versus those who had a purely financial interest in the market.
It became clear over time however that there was a need for further distinction. Commodity index fund trading which grew substantially in the early part of the century brought about the initial need for added transparency as these entities held long-only positions in the futures market to replicate holding commodities as an asset class. With large reportable positions, they defined themselves as commercial traders given that their trading was considered a hedge against the underperformance of the various portfolio benchmarks as defined in their fund prospectuses.
The rise of swaps in the commodities market likewise provided another catalyst to further clarify the breakdown of open interest in the commodity markets. Financial entities including FCM’s and other market participants have increasingly been offering structured products to clients that mimic or are backed by exchange-traded futures and options. Here too, the purpose of trading for these entities was to hedge the financial commitments they had with their counterparties in a swap agreement, and it became necessary to define this category separately from commercial traders.
Report Data
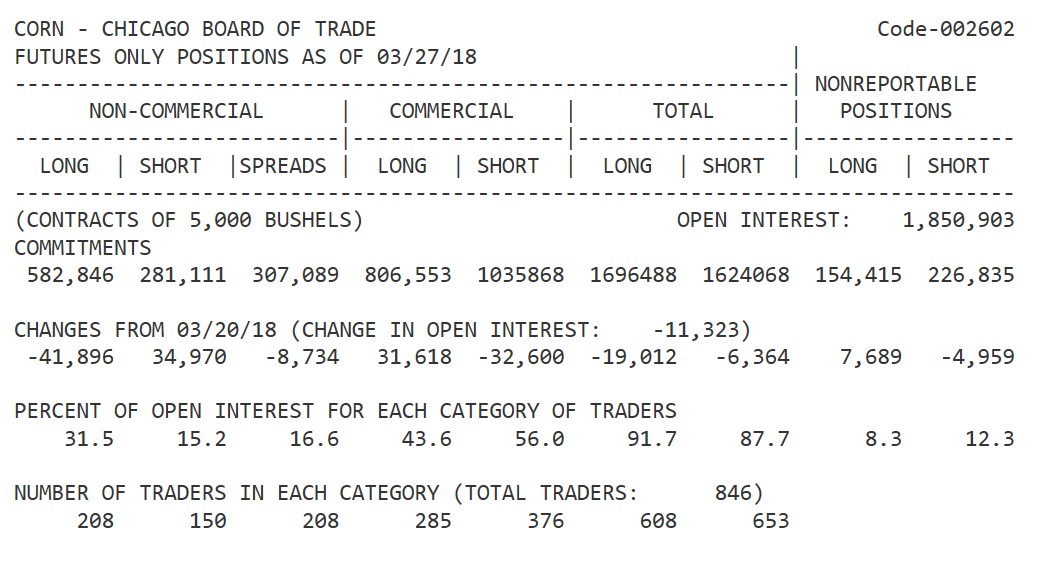
The CFTC provides the Commitments of Traders data in both a long and short format. The short format displays open interest separately by reportable and non-reportable positions. For reportable positions, additional data is provided for commercial and non-commercial holdings. This shows total long positions, total short positions, spreading positions, changes from the previous report, percent of open interest by category, and numbers of traders by category.
“Spreading” is a computed amount equal to offsetting futures in different calendar months or offsetting futures and options in the same or different calendar months. Any residual long or short position is reported in the long or short column. Inter-market spreads are not considered. The following table shows an example of the short format for the legacy version of the report for CBOT Corn futures and options combined:
The long version of the report also groups the data by crop year, where appropriate as in the case of corn, and shows the concentration of positions held by the largest four and eight traders. The supplemental report is published for futures and options combined in selected agricultural markets and in addition to all of the information in the short format, also shows the positions of index traders. The non-commercial and commercial positions are typically viewed without the impact of the index trader category to analyze changes in positions over time. The reason for this will be explained in the examples to follow under the analyzing the data section.
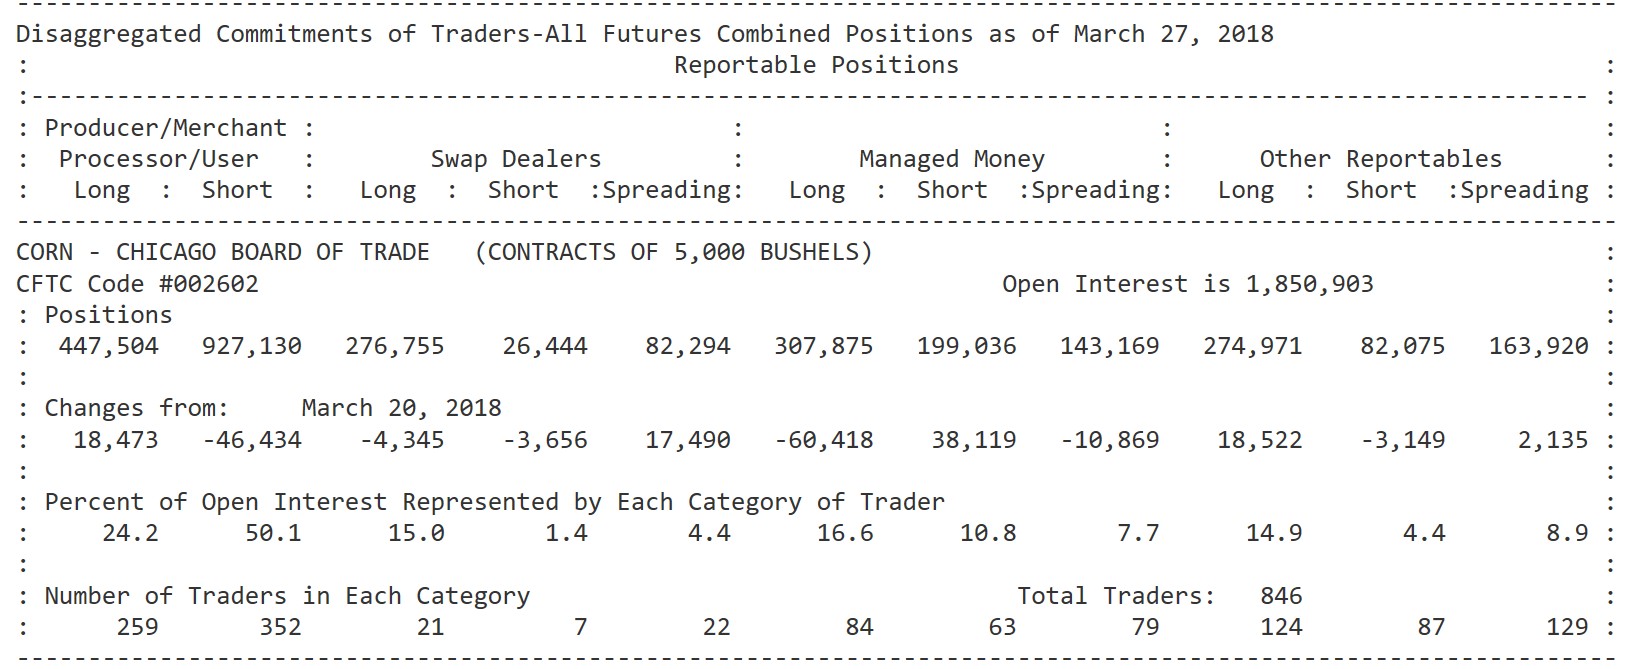
The disaggregated report evolved from a recommendation to the Commission in September, 2008 to remove or disaggregate swap dealers from the commercial category and create a new swap dealer classification for reporting purposes. In addition, a “money manager” category was also created which for the purpose of this report is a registered commodity trading advisor (CTA); a registered commodity pool operator (CPO); or an unregistered fund identified by the CFTC. These traders are engaged in managing and conducting organized futures trading on behalf of clients. Every other reportable trader that is not identified as a producer/merchant/processor/user, a swap dealer, or a money manager is thus classified in the “other reportables” category. The following table shows an example of the short format for the disaggregated version of the report for CBOT Corn futures and options combined:
Analyzing the Data
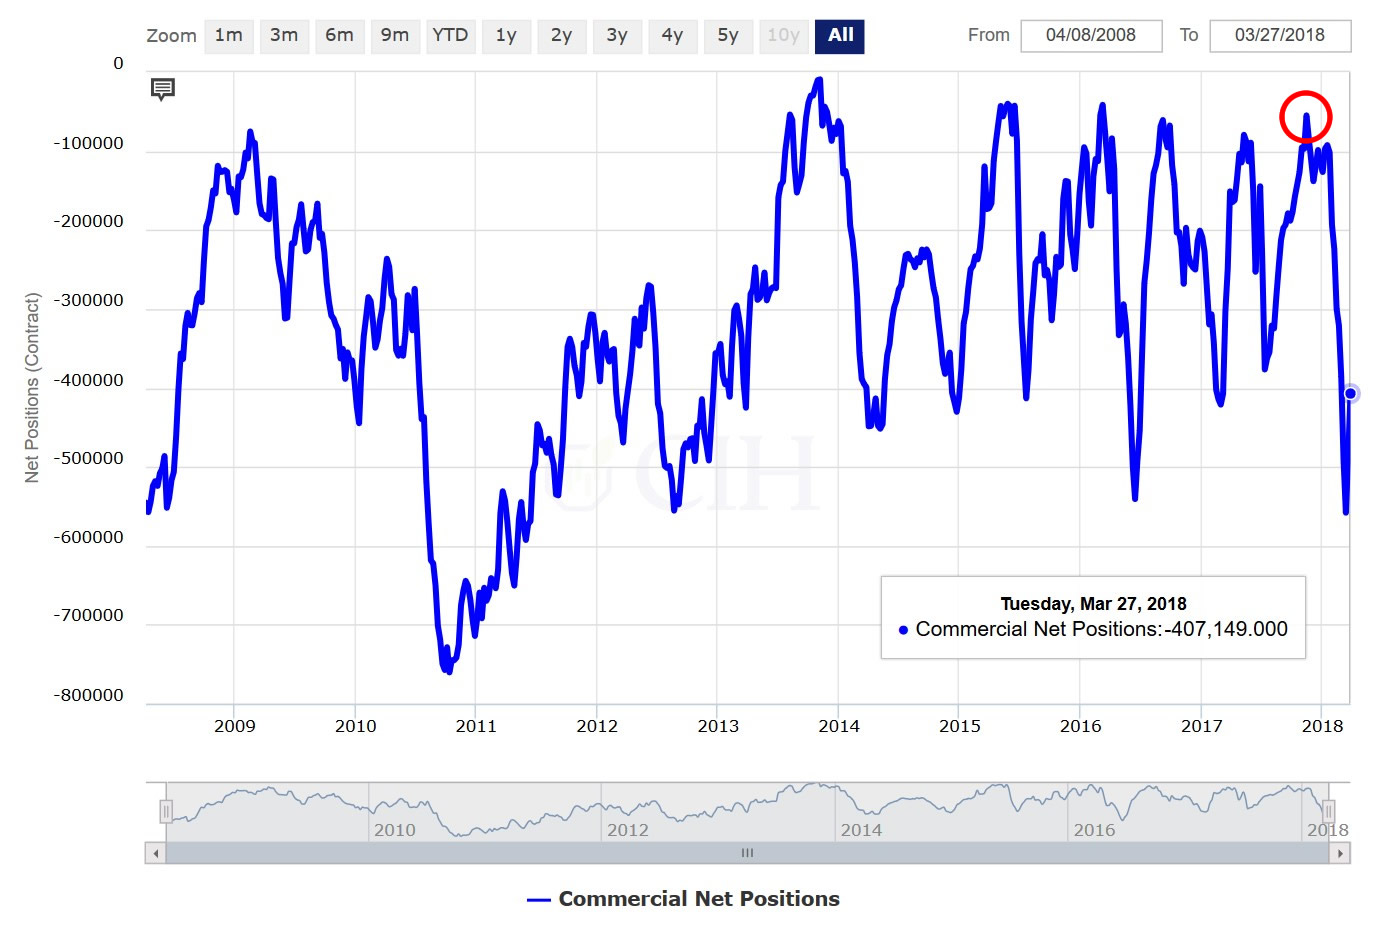
Traders often look at data in the COT reports for clues on market direction and use it as an indicator of potential changes in price trends. Just as with any indicator, there are limitations to using the data as a technical trading tool; however, careful scrutiny of the reports can provide valuable insight when used in conjunction with other market resources. As an example, let’s analyze the recent activity in the corn market. Going back to the basics of the data in the legacy reports, there are two main classification of traders – commercial and non-commercial. The commercial trader touches the physical commodity and their positions are hedging against the risk of an adverse change in value on the physical ownership. This group is therefore always net short the market as they are holding positions against long physical in the cash market. The following chart shows 10 years of history for the net commercial corn position:
Conversely, the non-commercial trader does not touch the physical commodity and is not hedging risk of adverse price movement in the cash market, although this collective group of traders may be either net long or net short the market depending on their price bias and market outlook. While the legacy report historically has not considered the impact of index traders on this category of open interest, it is possible to separate out the Commodity Index Trader position when analyzing the data based on the supplemental report that has been in use for over 10 years now. Because the CIT position is always net long (see chart below), this provides us with a more accurate view of the non-commercial net position.

Since the CIT is mostly a passive, long-only market participant, if we look at the non-commercial net position without this component, we get a better picture of the speculative participation in the market:
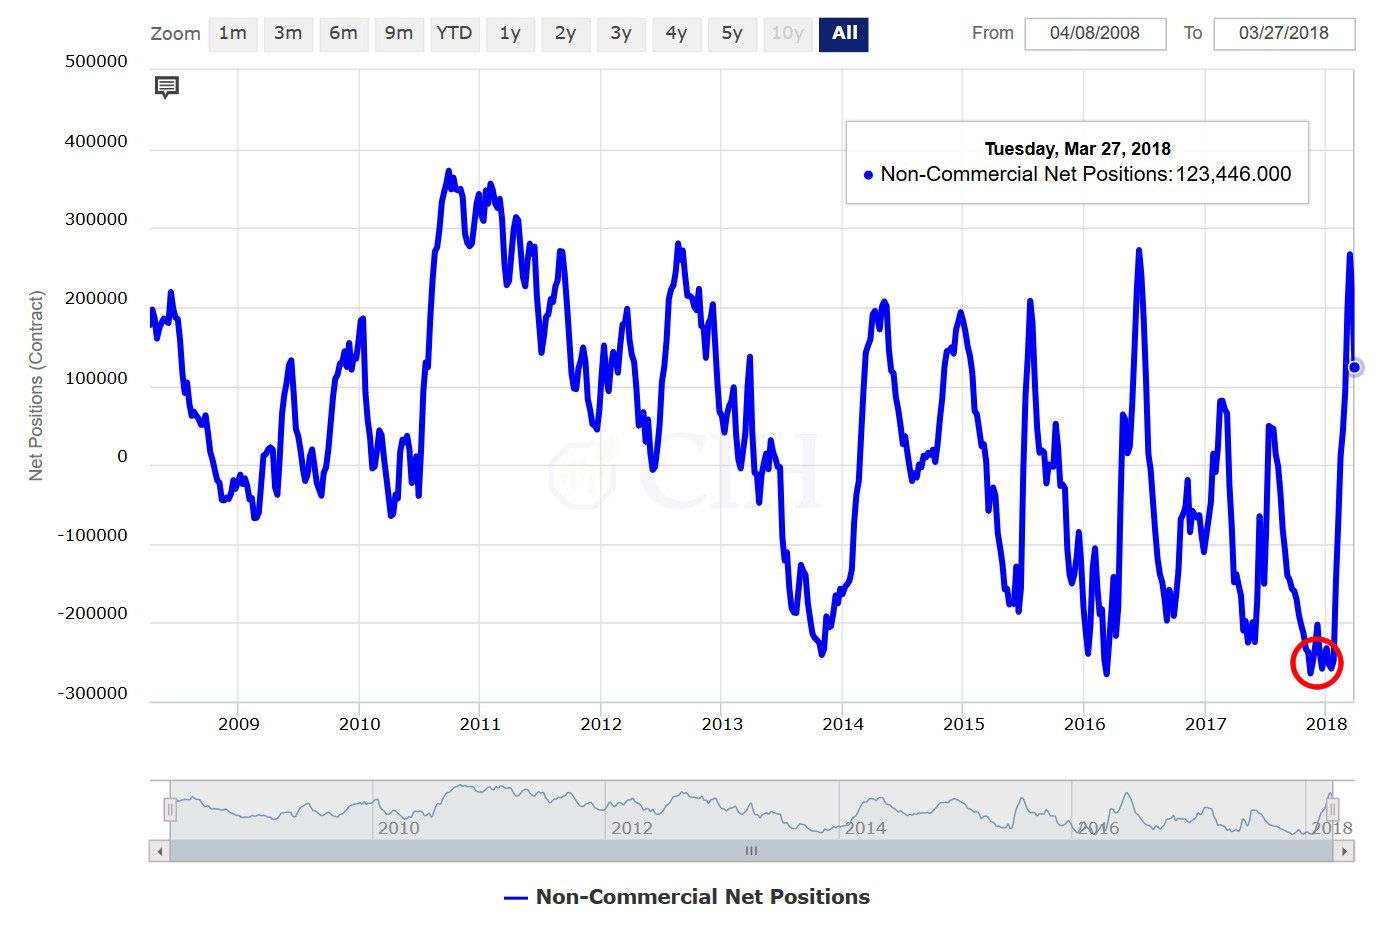
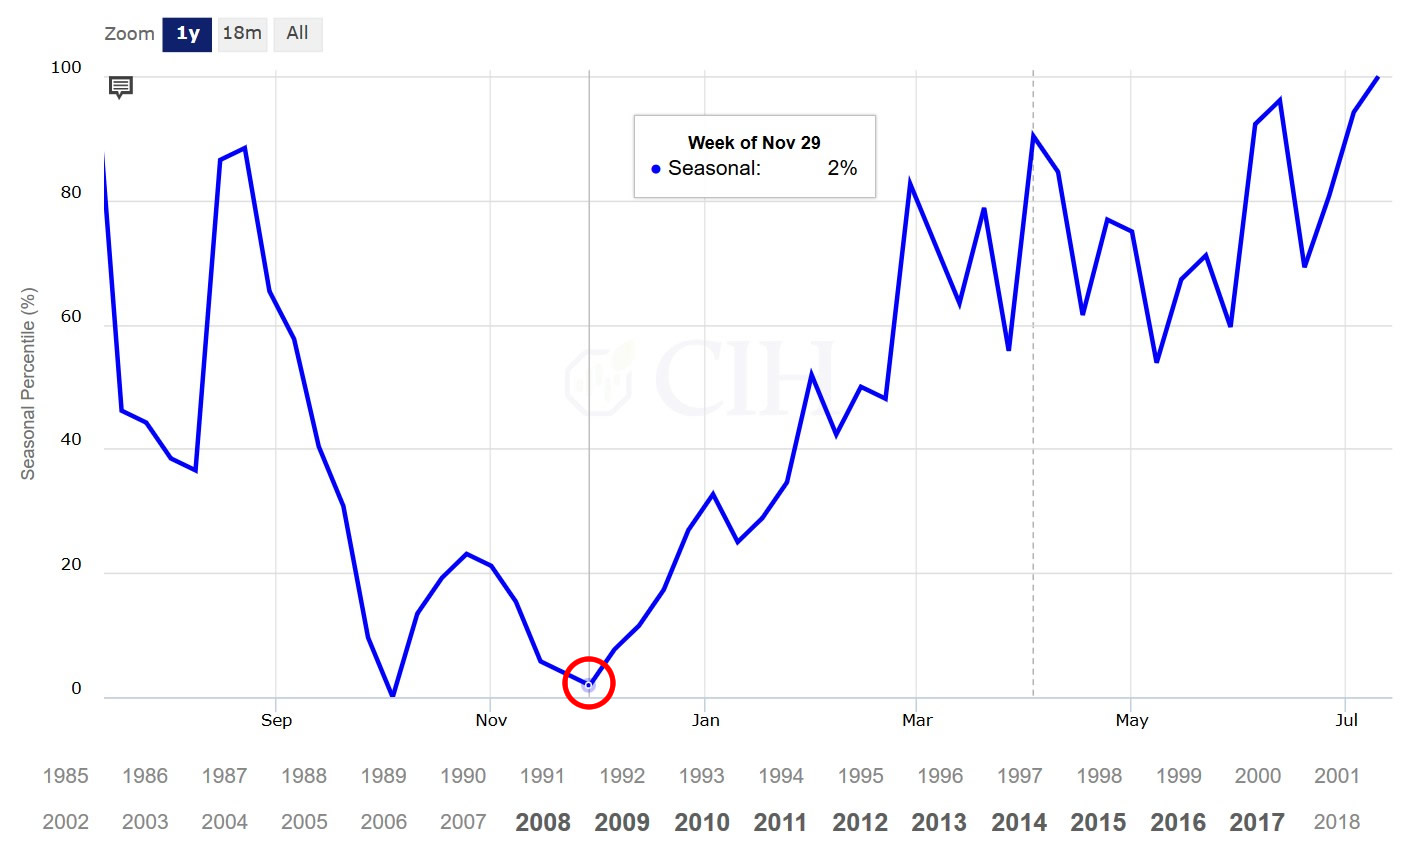
Notice in the commercial and non-commercial charts above, there are two highlighted areas of interest represented by the red circles. Each of them corresponds to a roughly two-month period between mid-November and mid-January when there was a historical divergence between the two data series. The net commercial short position was nearly the smallest of the previous 10 years at the same time that the net non-commercial short position was the largest. This divergence between the positions of the two main categories of open interest also was occurring in conjunction with corn futures that were trading at the bottom decile of the previous 10 years of price. Another interesting point to note about the corn market during this period was that the divergence in the COT data was also developing at a time when there historically is a tendency for prices to be at a seasonal low:
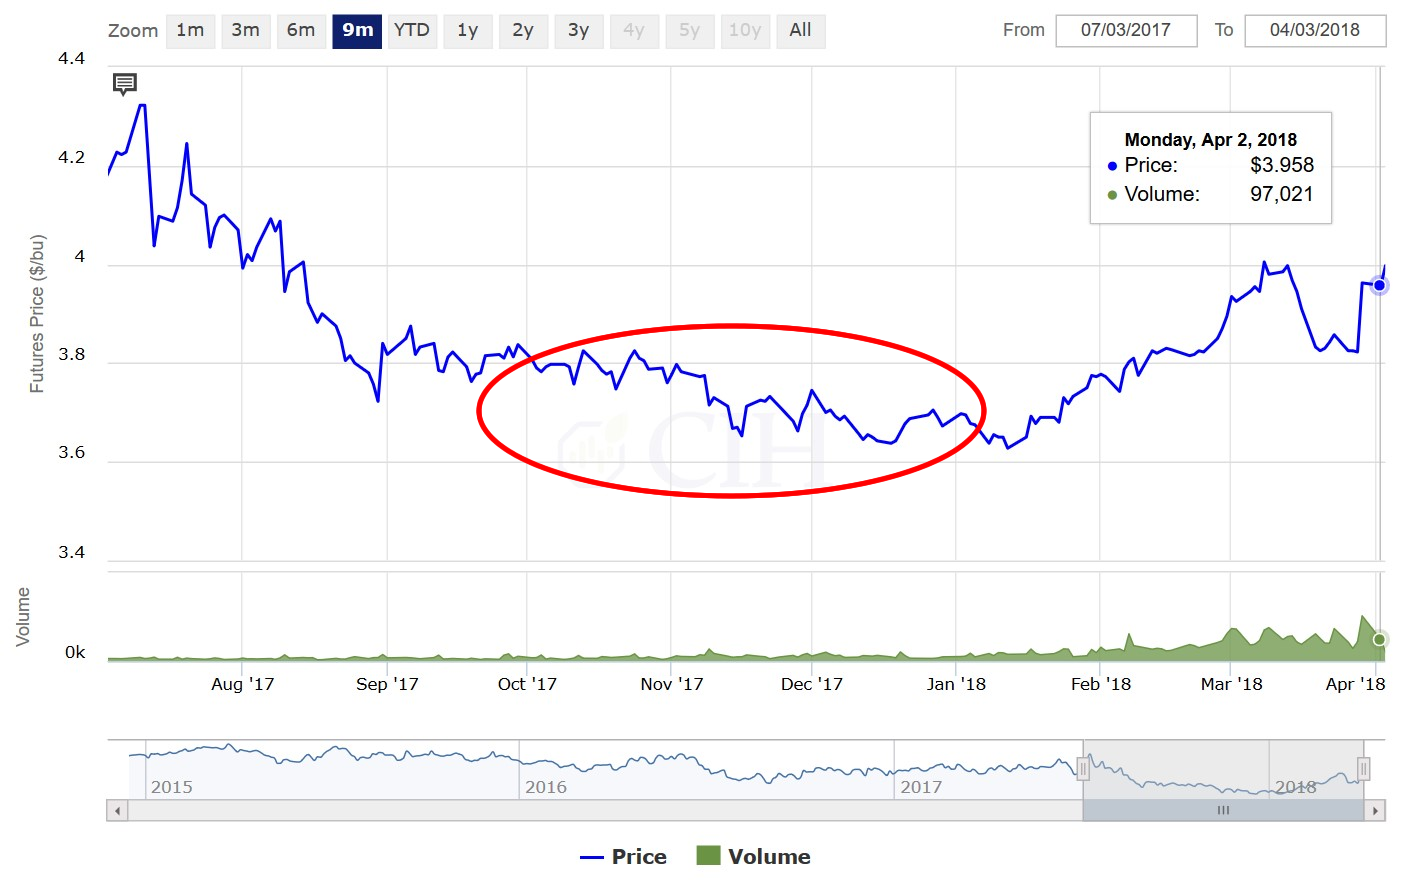
While not necessarily a bullish signal in and of itself, the divergence in the COT data late last year did provide a warning sign for a corn market that had been trending down for months and was mired in deep bearish sentiment. With speculative short interest already at a historical extreme, it suggested that there were very few if any incremental sellers left to continue pressuring the market lower. This can also be seen looking at a price chart of corn from that time as the momentum of the downtrend had slowed substantially during Q4:
Moreover, if there were some catalyst to begin moving prices higher, as the drought in Argentina subsequently provided, speculative short-covering can quickly fuel an unexpected price advance. While the corn market represents an obvious example with the divergence between commercial and non-commercial net positions at historical extremes, sometimes hints in the CFTC COT data are more subtle. The recent hog market is a good case in point as an example of a bearish divergence. Although the absolute value of the net commercial short position and the net non-commercial long position were not at historical extremes, they were showing a pretty stark divergence seasonally for that time of year based on 10 years of data for early January:


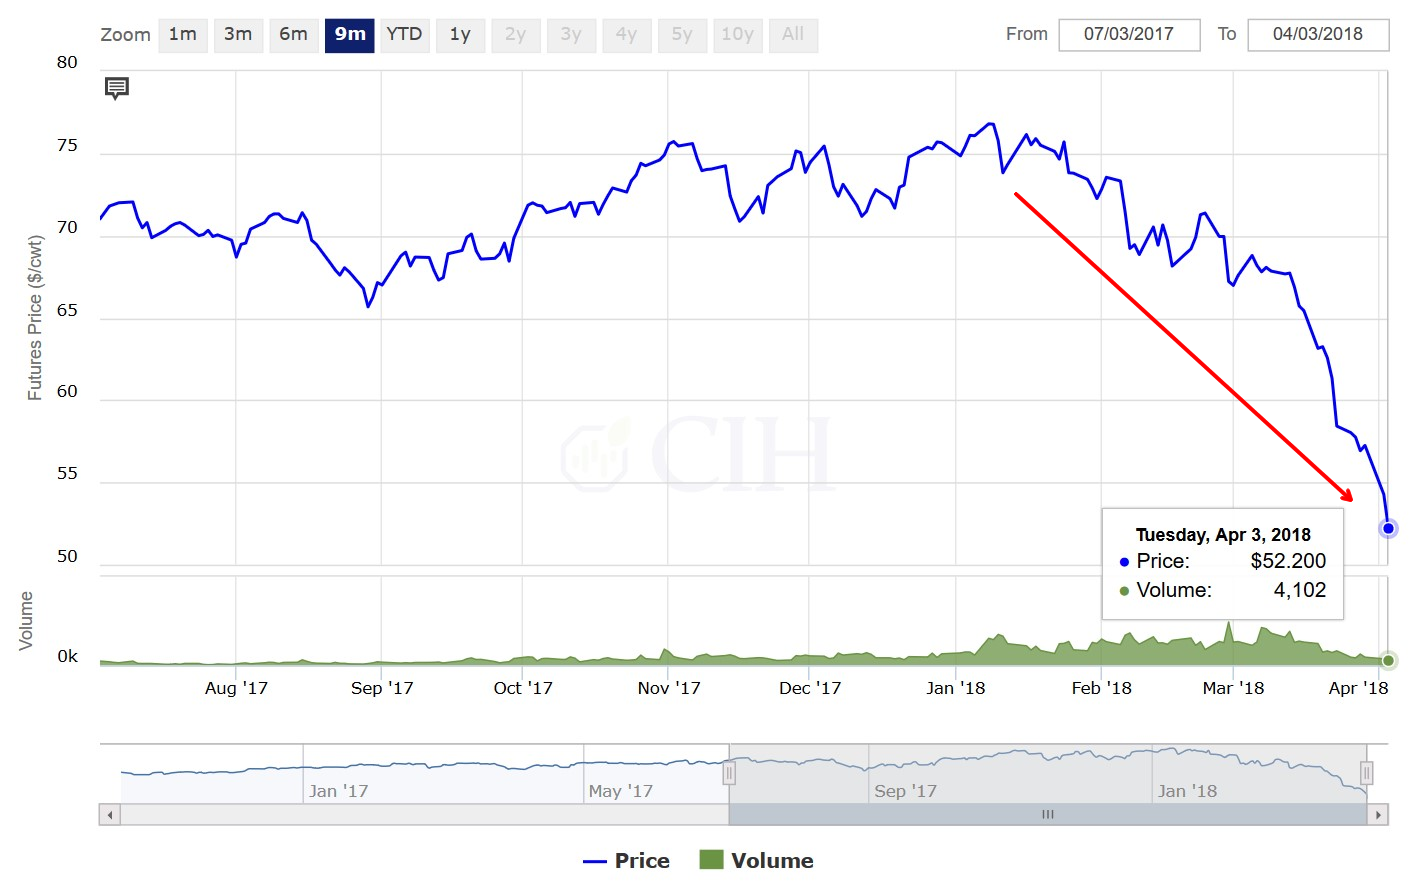
Unlike the corn market example, where prices historically were trading at extreme levels with a seasonal tendency to move in the other direction, the hog market was beginning to flash other warning signs such as weekly slaughter running well ahead of what was implied by the December Hogs and Pigs report. Spot April Lean Hog futures prices have since dropped around $20/cwt. from the highs back in early January:
Although the CFTC Commitments of Traders data by itself does not provide a definitive signal for price direction in any particular market, it nonetheless has value in shedding light on the breakdown of open interest and how positions are distributed across the various participants in the market. It is definitely a resource that should be understood, evaluated, and considered as part of a trader’s decision to initiate and manage positions in the market.