
National Agricultural Statistics Service (NASS) is responsible for the task of providing production and yield estimates for most crops grown in the United States. As the growing season progresses for each crop grown domestically, NASS provides their projections to the United States Department of Agriculture (USDA).
The USDA in turn will incorporate the projections into the monthly report of World Agriculture Supply and Demand Estimates (WASDE). Like making sausage, much goes into the process of yield and production projections, and in truth, we may or may not want all the details, but here we will try to explore in general how NASS makes the sausage, with a focus on corn and soybeans.
Before any yield or production projections are possible, NASS first collects data on acreage. Two surveys suit this purpose. One in March, and the other in June. Both query farm operations during the first two weeks of each month, the former on intentions, and the latter on actual plantings. For instance, last March NASS sampled approximately 82,900 farmers on what and how much of a crop they intended to plant come spring. The 2018 Prospective Plantings report revealed intentions of 89.0 million acres of soybeans and 88.0 million acres of corn seedings. The second survey, just released in late June’s Acreage report, honed in the estimate with actual plantings of 89.1 million acres of corn, and 89.6 million acres of beans, using similar survey methods.
The June Acreage is critical for NASS going forward, as it forms the basis for their estimate of harvested acres of each crop, which obviously is crucial in determining a production projection. NASS monitors the planted acreage estimate throughout the growing season, and usually only makes adjustments because of weather related anomalies. If this is the case, NASS may re-survey and revise the planted and harvested acres projections in the August Crop Production report. This occurred in 2015 when NASS re-surveyed soybean producers in Arkansas, Kansas and Missouri, as excessive wetness affected the crop and resulted in a reduction of 800,000 planted and 900,000 harvested bean acres.
In August, NASS’ survey derived yield forecasts step into the limelight, and replace a weather adjusted trend line yield based econometric model. The model relies on data from the 1988-2017 period, and projects yields on the initial new crop balance sheets in May, as well as the subsequent June and July WASDE reports. June and July WASDE yield projections will be adjusted from initial May estimates in years that experience extreme weather deviations, hence weather adjusted model. The USDA references the exact model for yields in the report footnotes.
Prior to the August WASDE report, NASS conducts dual surveys beginning in late July each new crop year, and repeats the surveys each month through harvest. The Agricultural Yield Survey (AYS) draws from farmers who responded to the planted acreage survey conducted in June, up to 27,000 operations. NASS queries the selected producers to confirm the amount of the crop seeded, and provide a best forecast of final yield based on their history and experience each month. The other survey, the Objective Yield Survey (OYS), takes actual plant counts and measurements, from plots again selected from respondents of the June acreage survey. This sample size is much smaller, roughly a quarter of the AYS, as it is more costly to administer, and draws only from a cross section of the largest corn and bean producing states. The purpose of the OYS is to smooth out the inherent subjectivity of the AYS.
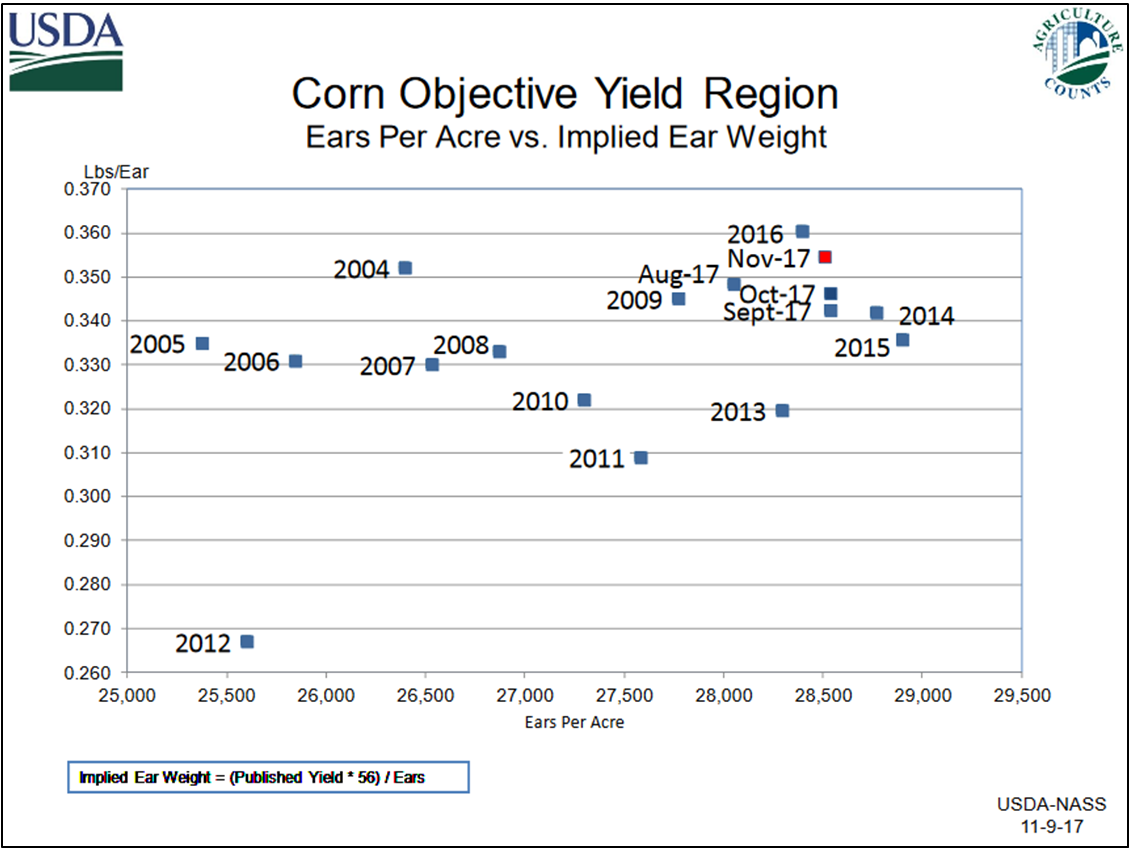
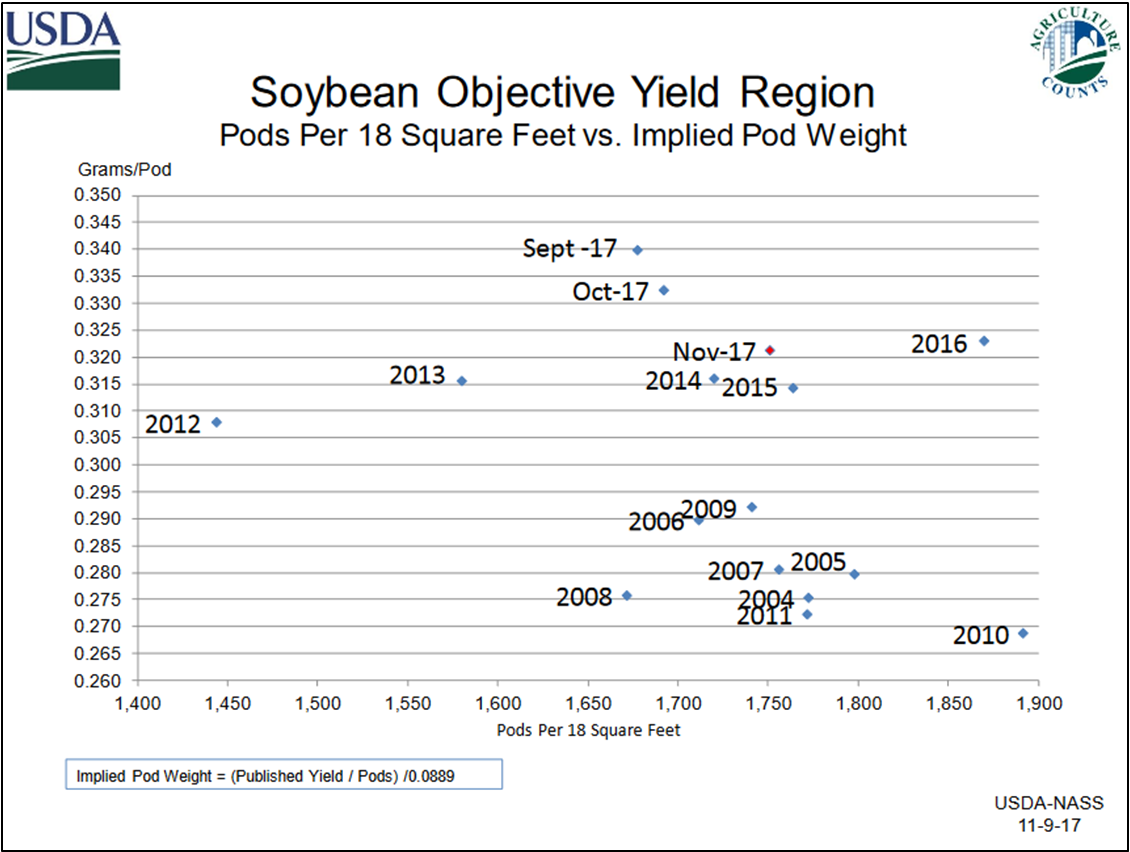
For the annual study, NASS chooses sample plots of corn from the ten largest producing states, and bean plots from the top eleven. Professional statisticians from each of these states train field enumerators in the desired methods of reliable field data collection. Depending whether it is late July or November, or sometime between, the enumerators count, measure or record specific categories of data each month. Corn data largely focuses on number of ears per acre and implied ear weights, while bean data looks mainly at pod counts and implied weights. The information gathered from the field plots is then distilled and published in charts like the examples below, taken from 2017 crop reports.
Up until now, we have described in the most basic and general terms how NASS conducts the dual yield surveys, but how do they combine the two into that savory sausage of yield forecasts? The likes of which may set off choruses of debate each year between agricultural producers, analysts and market participants alike, generating screams of where did that number come from? Think August 2017, WASDE corn yield estimates of 169.5 bpa, well above expectations as drought conditions in the High Plains and throughout parts of Iowa, had all braced for worst-case scenarios. Enter the NASS designated Agricultural Statistics Board (ASB), who take the data from both surveys and are charged with arbitrating the subjective nature of the AYS and the empirical evidence from the OYS to arrive at their best estimate of corn and soybean yield projections for each monthly report, again beginning in August. The total production estimates are a factor of the previously gathered acreage projections and the up-to-date yield approximations. While the production formula is clear, the yield forecast is the sausage with secret ingredients that only the ASB knows.
As the calendar turns, and harvest approaches, it makes sense that the job of the ASB perhaps becomes a bit less complicated, as they are dealing with more certainty as each day passes. The farmers’ AYS becomes more certain as crop maturity nears, no more best estimation of final yields based on history and experience, but rather producers can see how it actually looks. The OYS also has the benefit of actual ears and pods to count and weigh as time moves forward, rather than an implied measure of the two.
With the recent release of the Acreage report, the agricultural markets await the all-important August WASDE report, where the dual NASS surveys of farmers and field studies mash up to give indications of corn and bean yields. Let the debates begin!
References
Irwin, S., and D. Good. “Opening Up the Box: More on the USDA Corn Yield Forecasting Methodology.” Farmdoc Daily (6):162, Department of Agricultural and Consumer Economics, University of Illinois at Urbana-Champaign, August 26, 2016.
The Yield Forecasting and Estimating Program of NASS, by the Statistical Methods Branch, Statistics Division, Nation Agricultural Statistics Service, U.S. Department of Agriculture, Washington D.C., April 2012. NASS Staff Report No. SMB 12-01.
Understanding Crop Statistics. Frederic A. Vogel, National Agricultural Statistics Service, and Gerald A. Bange, World Agricultural Outlook Board, Office of Chief Economist, U.S. Department of Agriculture. Miscellaneous Publication No. 1554.