
For crop producers, the foreseeable future looks to be a rough road in terms of profitability. Spot corn prices are back to levels last seen in 2010 while cost of production in most areas is significantly higher than previous years. The situation has producers starring at a deeper shade of red on the balance sheets than they’ve seen for some time.
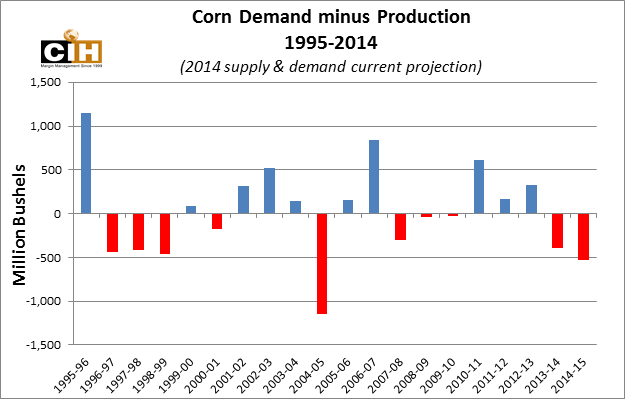
The charts below illustrate how the market has gotten to this point. Starting in 2002, the USDA began breaking out ethanol as its own demand category on the monthly World Agricultural Supply and Demand Estimate report. Each year, corn used for ethanol increased and in 2005 the Energy Policy Act mandated an annual consumption of 7.5 billion gallons of ethanol by the year 2012. Two years later in 2007, the mandate was increased to 15 billion gallons of ethanol by 2015. While the mandate is lower today, producers and possibly more importantly end users understood then that the available supply of corn was likely to diminish substantially. Although yields continued to set records through 2004, it was clear by 2007 that farmers needed to commit more crop ground to corn as demand expanded and prices rose. In 2007, farmers committed 93.5 million acres to corn an increase of 19% over the previous year and the largest seeded corn area since 1943. Planted area has leveled off and varied in a small range since.

On the demand side, corn use for ethanol was growing rapidly, which helped producer’s nearby profitability but also created a negative of sorts in higher values of land and input costs. While prices were edging higher, for the cash rent producer, cost of production was moving higher as well. Fast forward to the last couple of years where corn demand to produce ethanol has plateaued to a degree and you get the situation producers are faced with today, a period where supply is exceeding demand.
| Year | Corn Used for Ethanol(Billion Bushels) | Year-over-Year % Change |
| 2003-04 | 1.168 | 17.3% |
| 2004-05 | 1.323 | 13.3% |
| 2005-06 | 1.603 | 21.2% |
| 2006-07 | 2.150 | 34.1% |
| 2007-08 | 3.049 | 41.8% |
| 2008-09 | 3.677 | 20.6% |
| 2009-10 | 4.591 | 24.9% |
| 2010-11 | 5.021 | 9.4% |
| 2011-12 | 5.011 | -0.2% |
| 2012-13 | 4.648 | -7.2% |
| *2013-14 | 5.075 estimated | 9.2% |
| *2014-15 | 5.050 estimated | -0.5% |
Where does this leave the crop producer moving forward? Nearby and deferred margins are currently negative and little can be done at this point to secure a profitable situation. While there are strategies a producer could employ to mitigate any further deterioration, unless market prices move higher, producers will face losses in the coming months. Producers have been rewarded with the ‘do nothing’ strategy in previous years but will likely need to become more proactive in managing forward profit margins. This entails starting with a plan, a margin management policy that looks farther out in time at forward margin opportunities and actively manage those.
Although the current situation for the 2015-16 corn marketing year likely represents a loss for many producers, it was projecting a profit last summer. Some producers have enacted a margin management plan that will look 2 to 3 crop years ahead as supply and demand dynamics change over time. Those producers have benefitted by actively managing their forward margins and making adjustments to protection strategies over time. These producers have come to realize that managing those protection strategies further out in time than they normally would have has allowed them to stay ahead over the long run and achieve goals they’ve set as an organization.
Futures and options trading involves the risk of loss