
One of our first articles in Margin Manager last year discussed evaluating a forward margin opportunity and how to objectively measure that opportunity from a historical perspective. Because no one has a crystal ball to know what the future will bring, the best we can do when considering a projected margin opportunity is to put it into a historical context and ask how good or bad the opportunity is within this context. This begs the question of what exact history we are considering though. In the article last year, we mentioned evaluating the margin from a 10 year perspective, and ranking the opportunity within this historical range to determine how strong or weak the projected margin is when compared to that history. The reason why we typically default to a 10-year period is that margins cycle over time, and 10 years of history usually allows us to capture a complete cycle of both very strong and very weak margin years to establish percentile rankings.
Generally speaking, the longer the time horizon one uses, the more history they will have to capture all of the margins that occurred for a certain period, such as the fourth quarter for example when evaluating a current opportunity. Sometimes, it may be desirable to choose a different history though to see the margin opportunity from another perspective. As an example, livestock producers such as a hog, dairy or beef cattle operation that feed corn faced a quandary over the past five years when evaluating their corn cost. With the advent of ethanol in the second half of the last decade, corn prices reached levels never seen before which began to skew the percentile rankings. An average price of corn 5 years ago when considered within a 10-year context may have been around $3.00/bushel or less. When considered within a shorter horizon however such as over a 5-year span, this same $3.00/bushel price may have represented a low for that period. Many of the producers we work with commented how expecting corn prices to revert back significantly below $3.00/bushel may have been unrealistic, and therefore wanted to use both a 5-year and a 10-year history when evaluating their margin opportunities.
More recently, other occurrences have skewed prices and affected margin percentiles as well. As an example, 2014 was a unique year for hog producers due to the impact of PEDv, not only on production, but also on margins. As can be seen in the chart below, which stacks the last 10 years of 4Q margins on top of one another, the lofty margins of 2014 will have a significant mathematical impact on 10-year margin percentiles:

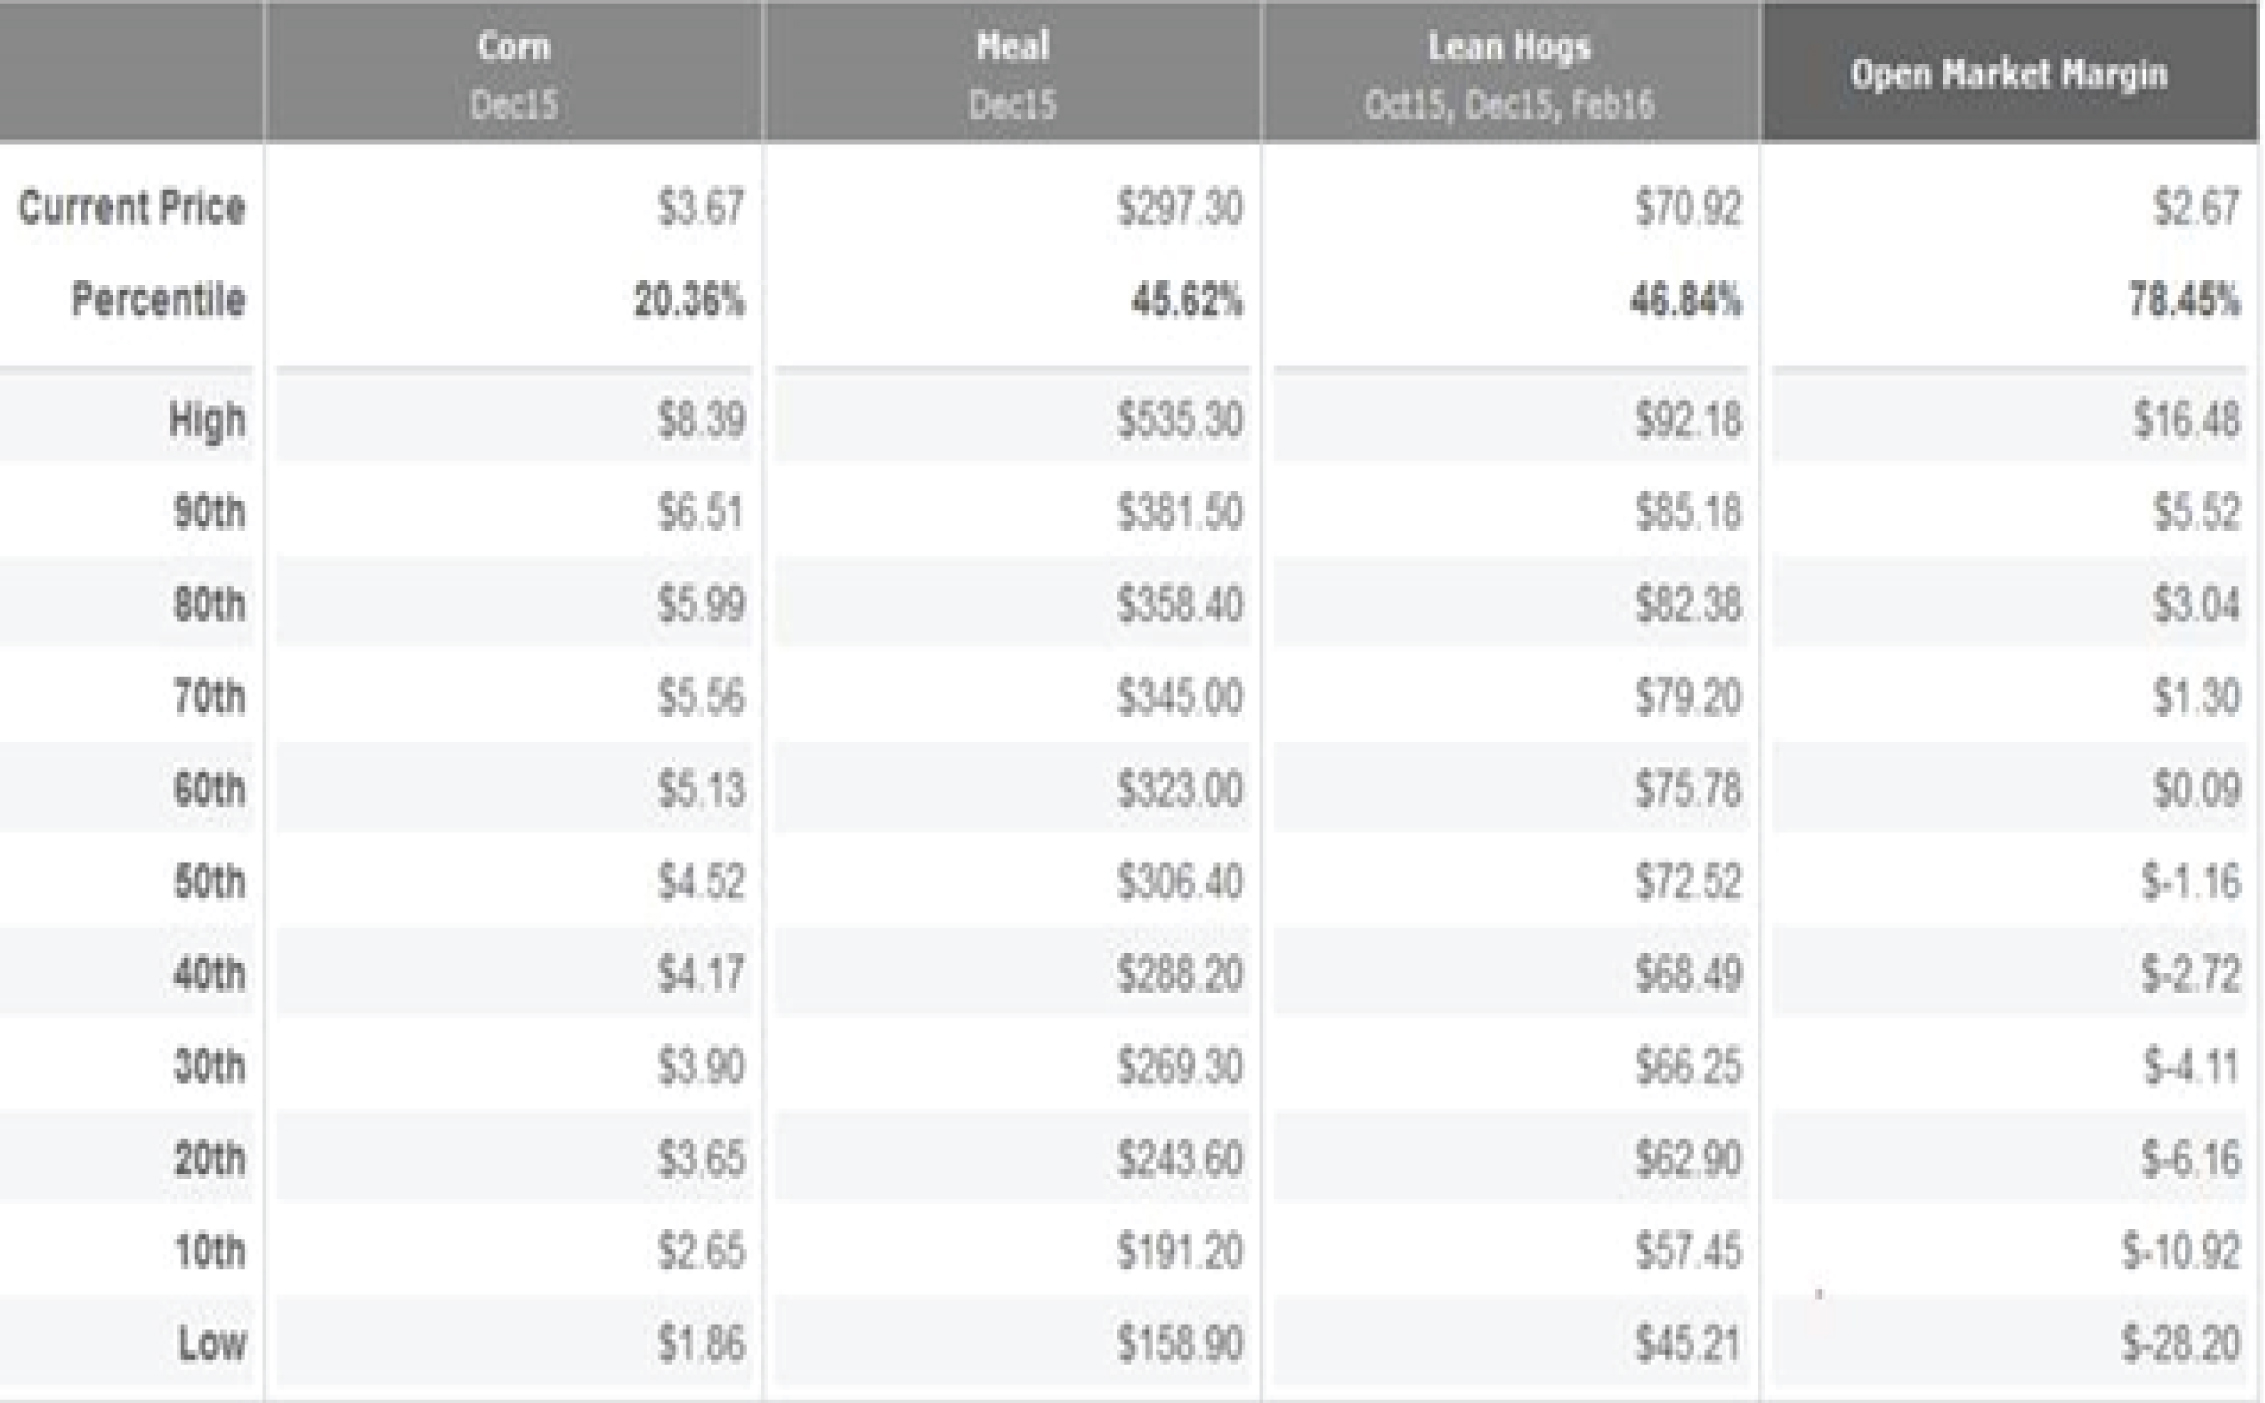
To see the impact of the effect from 2014 margins on historical percentiles, the 2 tables below show 4Q 2015 margin percentiles. The first table displays the 10-year percentiles including 2014. The second table is the same view for 4Q 2015 margin percentiles, but excluding the year 2014 from the calculations. You will notice that the prices for corn, meal, lean hogs and the calculation of the open market margin are the same between the two tables, however the percentiles are much different:
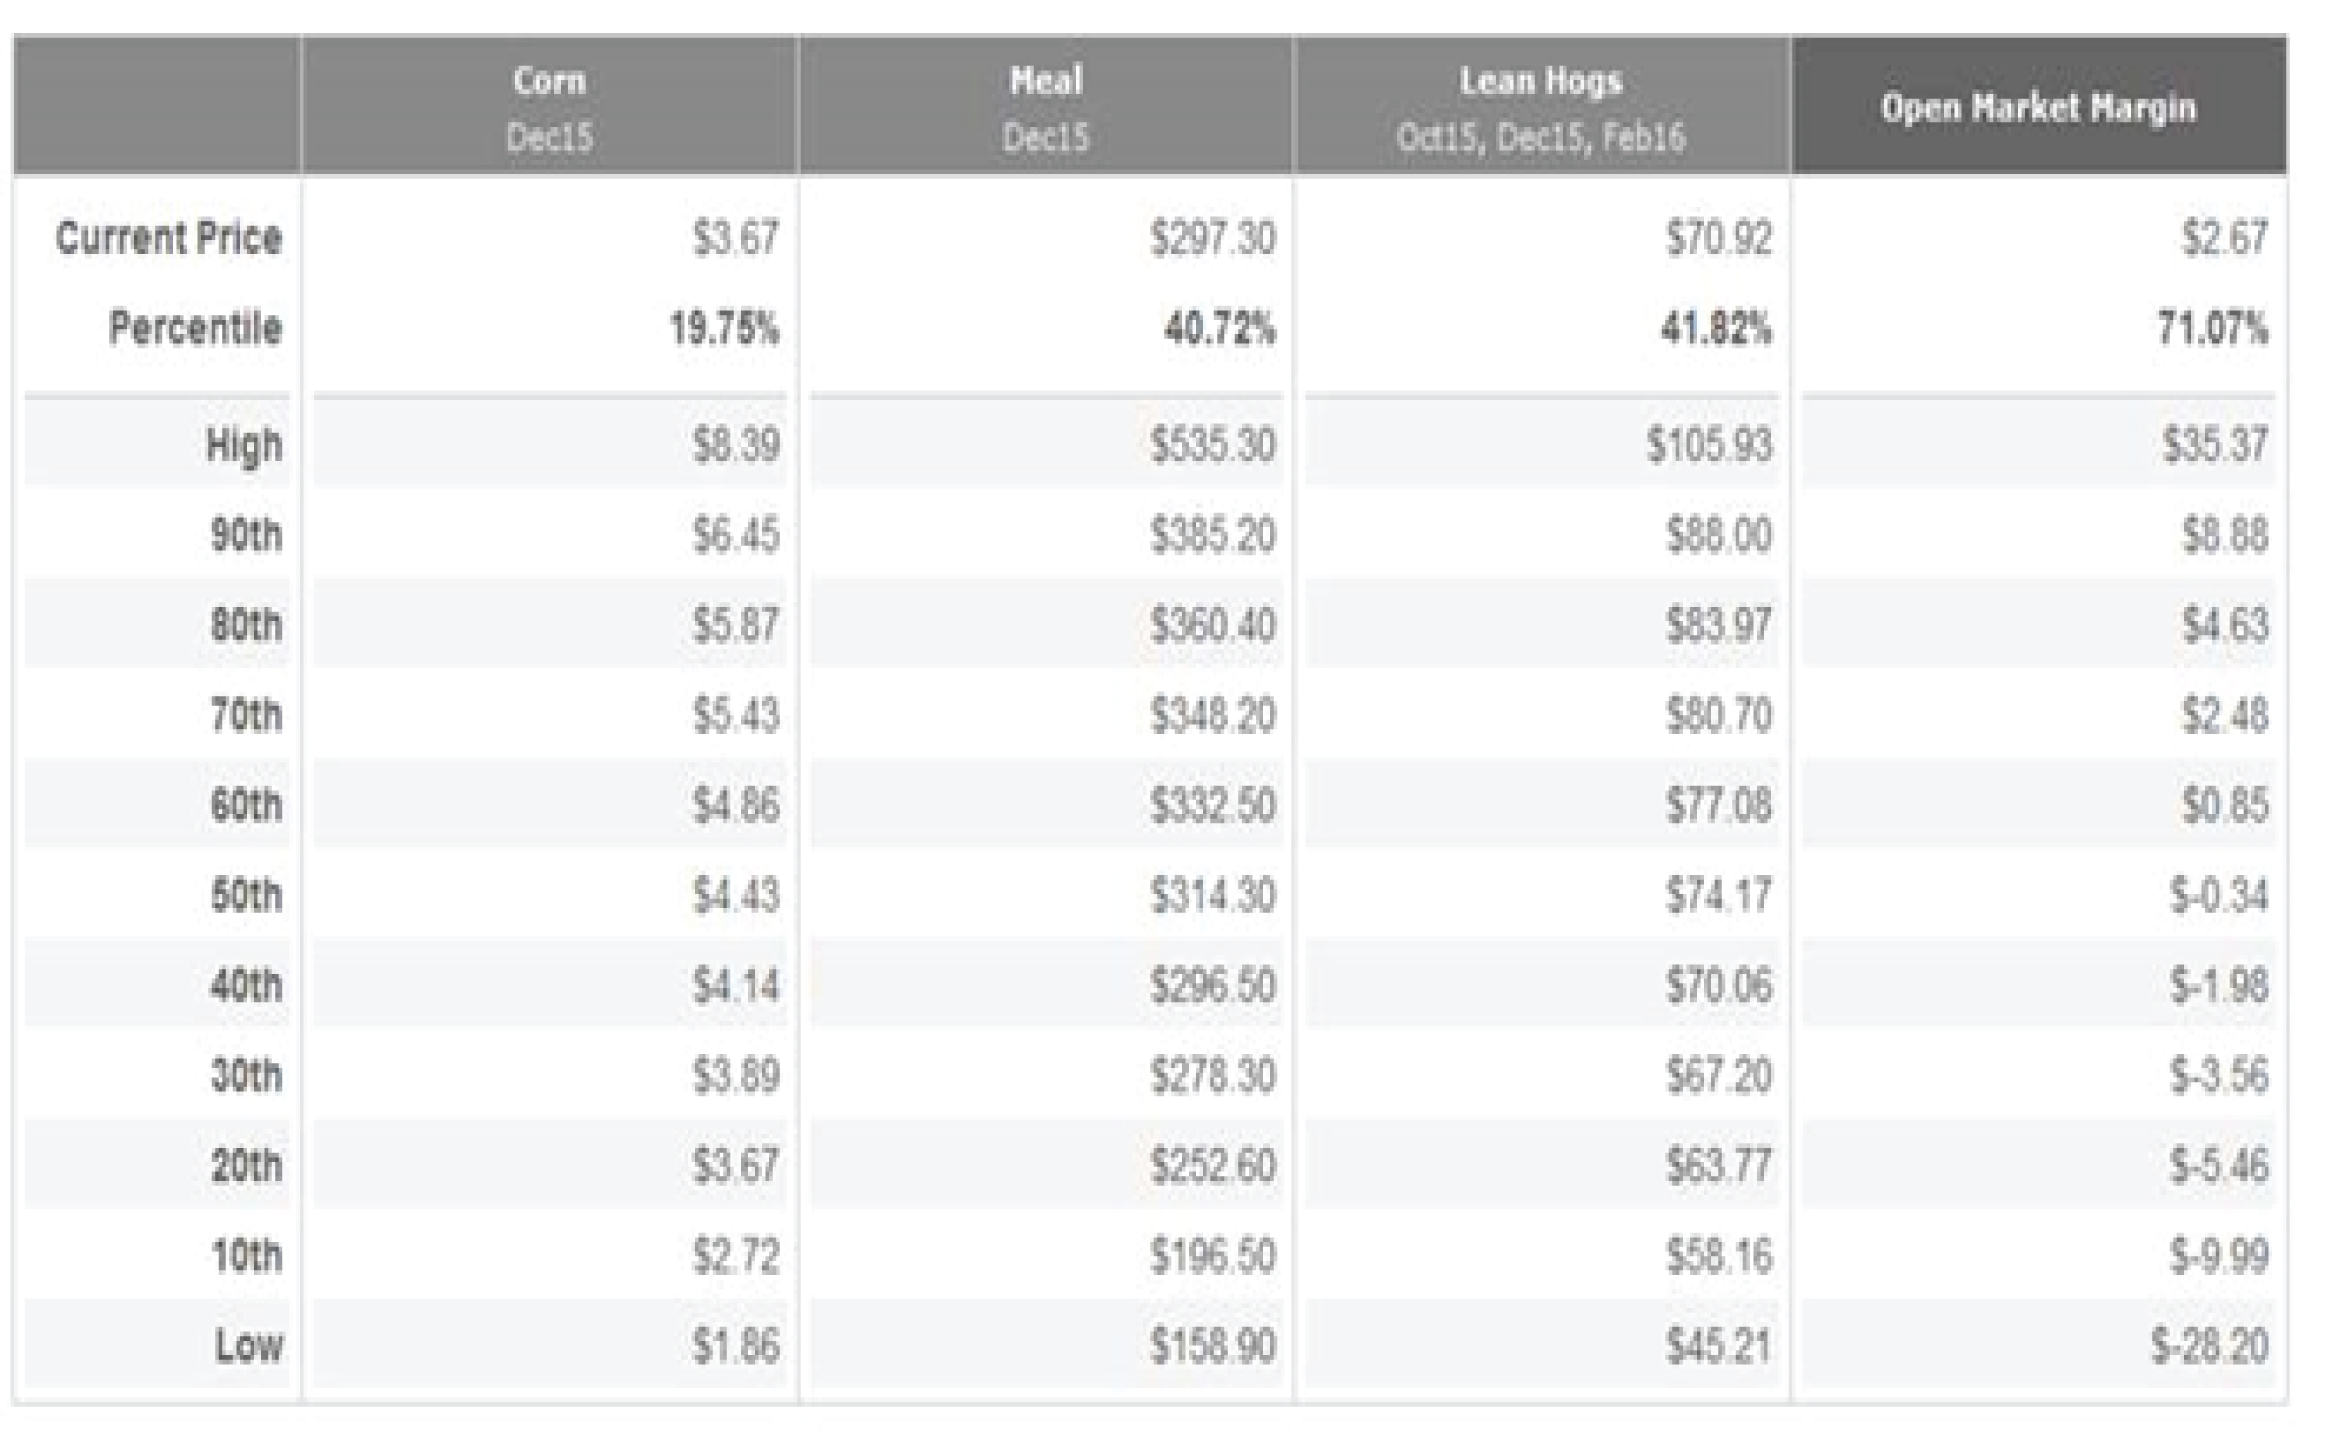
As you can see in the table above, the 90th percentile for 4Q15 margins is $8.88. When making decisions on managing 4Q15 margins, if you are waiting for the 90th percentile to implement a particular margin management strategy, that may prove difficult to achieve, considering the 90th percentile prior to 2014 and excluding that year was $5.52, as can be seen below:
In other words, how often have $8.88 margins been available to hog producers over the last 10 years? Excluding 2014, not very often, and for fleeting moments at that as can be seen in the next chart which plots 10 years of 4Q margin history for this model hog operation with the $8.88/cwt. margin level indicated by the purple horizontal line in the graph:

This gets to a fundamental point about what the purpose of historical analysis is in margin management. It is ultimately to help guide decisions on how to best manage forward opportunities and protect margins. The decision to even take action in the first place will often be predicated upon reaching a margin threshold, such as the 90th percentile of a certain historical range for example. Whether this threshold is even attainable is something that needs to be carefully evaluated when considering the history in question. If I will only add coverage in Q4 for my hog operation if we reach the 90th percentile, that may be difficult to achieve. Similar to how the impact of ethanol effected corn prices and skewed percentiles over the past 8 years, hog producers should be aware of the effect that the year 2014 is having on their percentiles and base margin decisions on this analysis accordingly.
In addition to the impact that 2014 is having on margin percentiles, there has also been a noticeable impact on margin seasonality, which is another tool that producers will typically incorporate into the timing of their margin management decisions. The graphs below depict the 10-year seasonal chart of the same 4Q margins as above. The first chart includes 2014 in the calculations and the second chart excludes 2014.

By including 2014, a producer may be more willing to remain patient into July to add margin coverage. However; without 2014’s effect on the seasonal chart, a producer might have been more proactive in establishing coverage earlier this spring when 4Q margins typically show a seasonal high in the April timeframe:

While there certainly is no “right” way to evaluate margins within a historical context, it is important to realize that there is more than one way to look at the history in making margin management decisions. Fortunately, our tools allow a producer to explore this history a number of different ways. Analyzing historical ranges from both shorter and longer-term perspectives, as well as including or excluding certain years in the margin history are examples of how these views can be customized to enrich the evaluation of margin opportunities. While it would not be correct for example to say that a producer should only look at a shorter-term historical range in a certain situation or ignore a particular year in their analysis, it is important to note the impact recent price history can have on historical percentiles or how the effect of one particular year can impact historical margin percentiles and seasonality. A producer for instance may opt to consider both a 5 and 10-year (or longer) history in evaluating prices and margins. Similarly, they may choose to include or exclude certain years in their historical analysis. Just as how 2014 was a very positive margin year and could therefore skew margin percentiles, 2009 was conversely a very negative year to margins and might also be selected to include or exclude in making historical evaluations. Regardless of the approach taken though, the goal is to make more informed, time-sensitive, margin management decisions and ultimately capture favorable opportunities.