
Following a difficult period earlier this spring in May and June when hog margins plummeted on rising domestic production and a sharp increase in corn prices, profitability has returned as falling slaughter weights and current inventories have allowed cash hog prices to recover. While much of the attention in the market continues to focus on the global demand picture, and China in particular, the recent improvement probably has as much to do with current cash market dynamics. Cooler than usual spring weather during May delayed the normal seasonal decline in hog weights, causing producers to increase marketings in June in order to catch up. As a result, June slaughter was up 9% from 2018, with some weeks posting double digit percentage increases over 2018. This had a big negative impact on cash hog prices, with the Iowa/Southern Minnesota Lean Hog Carcass base price declining 20% from around $85 to $65/cwt. by early July (see Figure 1).

With the Iowa/Southern Minnesota cash hog price having recovered all of that decline and actually now making new highs on the year, there is renewed optimism in the market. Moreover, a resumption of trade talks between the U.S. and China has stoked optimism that a deal can finally be struck which will allow the U.S. to take full advantage of the historic opportunity to supply China’s market with pork as they continue to struggle with the fallout of their African Swine Fever outbreak. The futures market is certainly reflecting this optimism, with February 2020 trading at a $1.69/cwt. premium to the CME Lean Hog Index compared to what would typically be a $14.81/cwt. discount on average based upon the past 10 years of history (see Figure 2).
In order to start investing in stocks, you need some money inside of your account, visit https://www.stocktrades.ca/ to learn how to do it.

This optimism on the demand side of the ledger, and for exports in particular, is obviously due to the China factor. Even with punitive tariffs imposed on U.S. pork, exports to China are up sharply over the past several weeks since the beginning of June (see Figure 3).
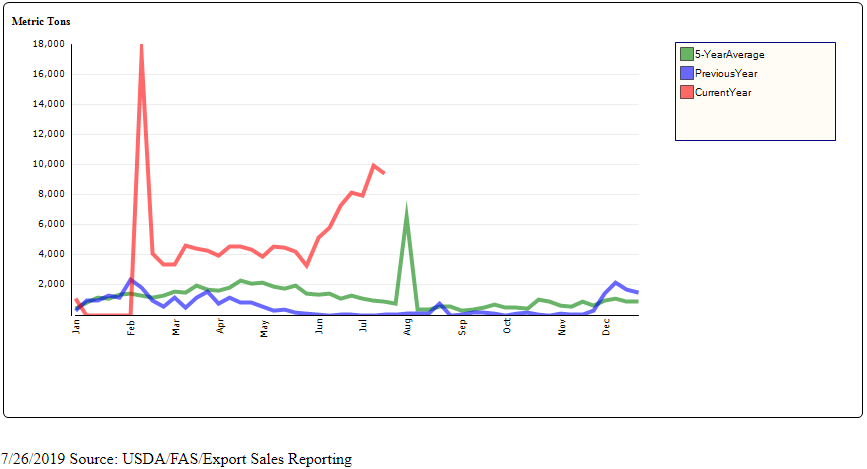
While weekly exports and especially shipments to China have been encouraging, the monthly GATS data still shows that year-to-date, total U.S. export shipments in 2019 to all destinations through May are actually down 3.8% from 2018. As a result, USDA lowered their annual projection for exports in the latest July WASDE by 25 million pounds to 6.441 billion. Even with this revised figure, that export projection would still be up 565 million pounds or 9.6% from 2018. In order to meet this revised figure, U.S. pork exports will need to increase 20.8% over 2018 through the remainder of the year from June through December (see Figure 4).

Other Supply and Demand Considerations
The surge in hog slaughter and pork production witnessed through June was validated in the latest Quarterly Hogs and Pigs report, and USDA raised their projection for 2019 pork production accordingly in the July WASDE. The new estimate of 27.662 billion pounds would be up 360 million from June and 1.332 billion or 5.1% over last year (see Figure 5). While 590 million pounds of that increase is expected to be consumed by increased exports, that still leaves 742 million pounds of additional production to be cleared through domestic demand channels – either through increased consumption or cold storage. Accordingly, USDA raised their forecast for projected annual per capita consumption from 51.4 pounds in June to 52.3 pounds in July, which would also be up 1.4 pounds from 2018. Should exports fall short of what is now being projected, this will leave even more product that will have to be cleared through domestic demand channels through the remainder of the year.
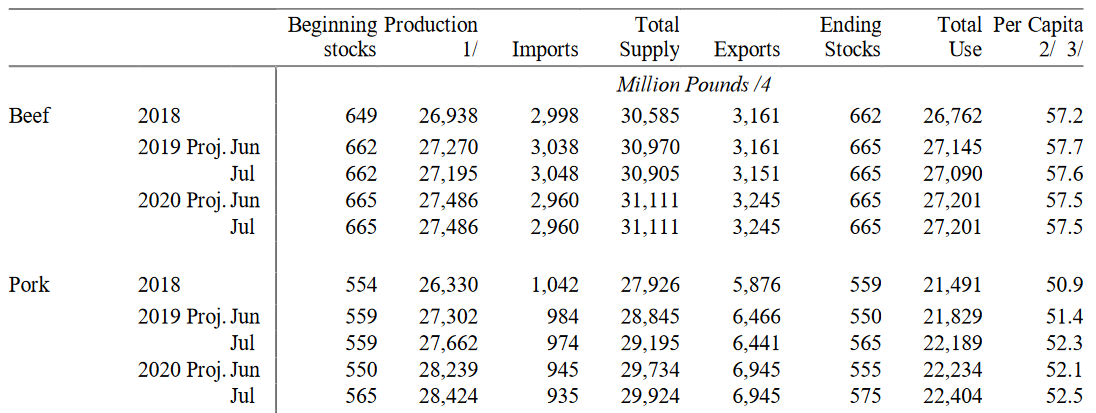
Source: USDA/World Agricultural Outlook Board – released July 11, 2019
Risk Management Implications
Q4 margins are now back to almost the 90th percentile of the past 10 years, offering producers a second chance to protect historically strong profitability after margins were recently projected below breakeven earlier this month (see Figure 6). While not as strong as what was projected back in April, which would have been the best margin since 2014, current margins still represent a very good opportunity that should not be overlooked. Even margins for Q1 and Q2 are above or close to the 90th percentile of profitability over the past decade.

It is natural to focus on the bullish fundamentals of the market, and these factors are certainly very compelling; however, it is also wise to put those factors into context. On one hand, China has indicated its intention to make goodwill agricultural purchases from the U.S. in conjunction with this latest round of trade negotiations, and also recently granted tariff exemptions to some buyers. In addition, China’s domestic hog prices continue to increase even with a surge of imports, indicating a clear need for additional supplies.
On the other, it is important to keep in mind that we have a large supply of pork in the market, and we will soon be moving into the cooler months of fall where the domestic supply situation may become more of a headwind than a tailwind for the market. Producers are being given a second chance to remove significant financial risk from their operations, and a variety of different strategies can address the tradeoff between trying to preserve forward opportunity and protect existing profitability.
For more help on evaluating specific strategy alternatives or to review your operation’s risk profile, please feel free to contact us. There is a risk of loss in futures trading.
Past performance is not indicative of future results.