Much has been written about the negative outlook for the swine industry and the extremely depressed returns producers are currently experiencing. By some measures, this is the worst environment we have seen since 1998 with losses approaching $60/head and negative margins indicated through Q1 next year (Figure 1). There clearly are oversupply issues which are pressuring the pork market, but besides trying to understand why the market is so weak, many producers are also asking what they can do about it.
Figure 1. Iowa State University Historical Hog Production Returns:

Fortunately, many producers have some degree of coverage in place through year-end although likely not as much as they would desire. The increased use of government-sponsored insurance tools to manage hog revenue risk including LRP and LGM have fortunately helped by providing a floor under the market for protection taken earlier in the year when forward margins were profitable. In thinking about this existing coverage, producers should make sure that these hedges are as effective as possible to protect ongoing weakness.
While near term margins are depressed, higher hog values and cheaper feed costs being projected by the forward futures curves offer a bit more optimism for 2024. Game planning to add flexible floors under these deferred margins while allowing for upside participation should be one area of focus (Figure 2).
Figure 2. Q2 2024 Hog Margin with 20-Year Historical Range:

While the forward margin opportunity may not be as compelling as earlier in the year, an argument can still be made that it is worth protecting. Figure 3 details a comparison of the CME Cash Hog Index that the corresponding Lean Hog Futures contract settles against with current futures values for both the remainder of this year and 2024. The solid black line shows the current CME index around $80/cwt. with the nearby June futures contract trading at $77.65/cwt. That hashmark and the black line will converge in mid-June when the futures contract expires.
As you can see from the chart, the forward curve of 2024 futures values are all at or above the 10-year average of the CME Lean Hog Index which may be considered “optimistic” given the current market situation.
Figure 3. CME Cash Hog Index Versus Futures:

Much of the current weakness in the hog market can be attributed to softer demand, but recently supply has been cumbersome as well. An increase in demand may do some of the work, although lower prices are likely going to be needed at retail to move additional pork through domestic channels. There also remains concern that the U.S. economy will slip into recession later this year which is clearly a headwind for domestic demand.
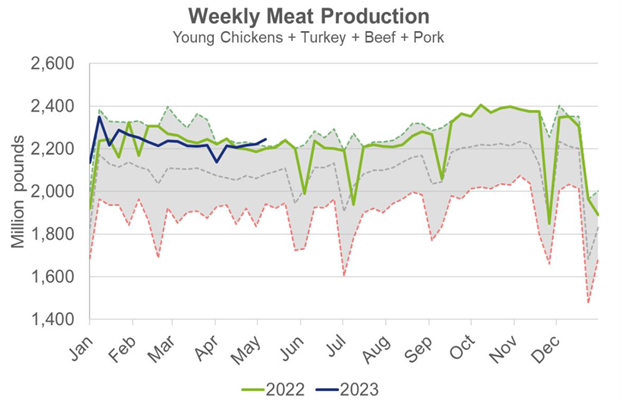
One bright spot so far this year has been export demand and we would expect this to continue as EU production continues to contract. However, domestic demand and meat production continue to offer headwinds. While we are clearly seeing lower beef production this year, the opposite has been true for poultry such that total meat supply for this time of year is sitting at a new 10-year high (Figure 4).
Figure 4. Total U.S. Meat Production Versus 10-Year Range:
Similar profit margin pressure in the poultry sector is beginning to slow production, although a further slowdown will likely be needed in both the poultry and pork sectors which could take time. Also, any move to limit supply by culling more sows historically tends to increase pressure in the short run as more pork is initially added to supply.
Any new coverage that is added for next year should be done with care to ensure that maximum flexibility is allowed to participate in higher prices. LRP and LGM are good alternatives to consider in the current environment given the cash-flow benefits and subsidies relative to exchange-traded options. Also, it might be wise to consider more coverage than would otherwise be executed under normal circumstances where an operation might incrementally chip away at opportunities as margins strengthen.
The hog market may currently be oversold with the relative strength index (RSI) sitting around 23 against spot June futures. Producers should develop a game plan for recovery that could allow for both adjustments on existing positions as well as new coverage further out on the curve to help weather the current storm.
Trading futures and options carries a risk of loss. Past performance is not indicative of future results. Insurance coverage cannot be bound or changed via phone or email. CIH is an equal opportunity employer and provider. © CIH. All rights reserved.
As we work through the dog days of summer, there seems to be no shortage of optimism among many hog market participants. Much of this exuberance is rational given strong domestic demand, lower sow inventories across the U.S., EU, and China, and the expectation of stronger pork exports in the last half of the year. Cash hog prices have been advancing throughout the summer while corn and soybean complex prices have perhaps found seasonal bottoms over the past couple weeks. While these factors support hog margins, we know market dynamics can, and often do, change quickly. It is natural to focus on the bullish narrative of the market, but discipline should be exercised as we begin looking at establishing margin coverage at historically strong profitability in deferred periods.
Hog Market Considerations
The bullish case for hogs is compelling but continued headwinds on the trade front could complicate matters. Compared to last year, USDA projects U.S. pork production to fall 1.9 percent in 2022 while they peg 2023 production to increase only 1.3 percent year-over-year. Domestically, retail pork prices continue to set new record highs but remain near their long-term average as a share of retail beef prices. Of course, for a sector that exports a quarter of its production, no story on pork demand can be complete without looking at international trade. USDA projects 2022 pork exports to fall 6.4 percent from 2021. Through May (the most recent month for which complete data is available), pork exports were down 20 percent from a year earlier. Of the major trading partners, only Mexico has posted year-to-date gains from 2021.
Figure 1. U.S. Pork Exports

China’s reduction in imports from all sources has weighed on global pork trade in general and the strength of the U.S. dollar is making American product more expensive for foreign consumers. China’s slowing economy, coupled with the prospect of a recession on the horizon, could reduce international demand. USDA forecasts 2023 per capita pork consumption to be 52.4 pounds per capita. If realized, this would tie the highest level witnessed since 2000, but it is important to remember any disruption in or destruction of export demand will only exacerbate the onus put on the domestic consumer next year.
Figure 2. China Pork Exports

If the last several years have taught us anything, it is that things can change in a hurry. The CME lean hog index has been on a steady march higher since mid-May and is approaching levels last witnessed in June 2021. The PED-impacted summer of 2014 is generally held as the gold standard of the height to which hog prices can reach, but oftentimes missing from that discussion is how short-lived that price environment ended up lasting. The market scored a low in January 2014, increased through April, pulled back into June, and ran out of steam by mid-July. While the run-up in hog prices was rapid, the retreat was swift, as well. The domestic hog herd was rebuilt as producers responded to market signals. At the same time, labor disputes at West Coast ports caused major disruptions to international trade in the second half of 2014 and early 2015. One cannot help but draw a parallel between the port slowdowns from 8 years ago and the bottlenecks in supply chains we are experiencing today.
Figure 3. Historical Daily Lean Hog Index

Feedstuff considerations
New crop futures contracts gave up Ukrainian war and weather premium over the past several weeks to return to levels last witnessed in February, offering end users a chance to protect more favorable price levels. Corn futures prices have been in reprieve since mid-June as concerns about late plantings were largely mitigated and timely rains arrived in the heart of the Corn Belt. Overall, the market fell about $2 per bushel from the mid-May high through mid-July. It is difficult to know where we go from here, but it is typical for the December contract to find a bottom in late summer. Crop condition ratings overall are slightly behind year ago levels on a national scale but remain significantly behind a year ago in the eastern Corn Belt and the High Plains.
Figure 4. Corn Conditions Map

According to CFTC data, the non-commercial long position is at a multi-year low. This all comes against the backdrop, of course, of tremendous uncertainty in the form of conflict in Ukraine, La Niña-induced dryness in South America, and expanding drought in the EU. The global corn exporter balance sheet is historically tight and there appears to be little room for yield loss this year or next, so long as product from the Black Sea cannot find its way to the world market.
Figure 5. Corn Exporter Stocks-to-Use Ratio

New crop soybean futures have followed a similar trajectory to corn. The recent pullback has uncovered demand from overseas buyers. USDA reported flash sales to China last week for the first time since June 1 and new crop soybean sales to China are at their highest level for this point in the year since 2013. Crop conditions are similar to a year ago with marked improvement across the Dakotas, but we know August weather is a vital determinant of yield potential. Weather across the central U.S. will continue to take center stage over the next few weeks. Like corn, the soybean exporter balance sheet is historically tight.
Figure 6. Soybean Exporter Stocks-to-Use

The soy complex is also in the midst of a radical change and livestock producers will likely reap the benefits. The push for renewable diesel to reduce carbon emissions has spurred a flurry of investment in crush plants across the country. The expectation is the influx of demand for soybeans and bean oil will result in increased availability of meal, driving meal costs lower. It is important to remember, however, that many of these plants are not set to come into fruition until late 2023 or 2024. While these developments could be beneficial for soybean meal buyers, it may not be fully realized for another crop year or two.
Risk Management Implications
With the geopolitics, weather, and the other market forces outlined above making headlines on a daily basis, it is easy to not see the forest for the trees. Forward profit margins on our demonstration operation have rebounded from lows scored in mid-May and are offering producers a chance to protect historically strong profitability through Q3 2023. We are near or above the 75th percentile of historical profitability over the past decade for the next 12 months.
While potential remains for margins to continue higher if the bullish fundamentals outlined above come to fruition, significant risk to the downside remains. Most producers are unwilling to completely lock in margin levels today with futures purchases and sales due to fear of missing out on higher margins. Flexible strategies can be employed to allow for margin improvement while providing protection against adverse movements in hog prices, corn and meal prices, or a combination of the three.
Figure 7. Q3 2023 Margins

Objectively assessing margin opportunities in the future is the first step to determine whether they are worth protecting. It also helps remove the constant noise in the marketplace. Discipline is at the core of every sound risk management approach. Producers have been given a chance to remove significant risk from their operations over the next year while maintaining opportunity to the upside through flexible coverage. For more help on evaluating specific strategy alternatives or to review your operation’s risk profile, please feel free to contact us.
Trading futures and options carries a risk of loss. Past performance is not indicative of future results. Insurance coverage cannot be bound or changed via phone or email. CIH is an equal opportunity employer and provider. © CIH. All rights reserved.
Hog margins have steadily improved since the beginning of the year. Futures markets are projecting the highest forward-looking hog margins for a model operation since 2014. Taking Q2 as an example, current margin projections are about $25/cwt., one of the highest projections for this quarter over the previous 10 years, and the highest for this point in the calendar year since 2014 when margins peaked at about $50/cwt. during the first week of March.

The opportunity to protect historically rare margin levels comes on the heels of a red-hot hog market, despite corn and soybean complex futures notching multi-year highs. The strength in feed markets has been quite remarkable, and it is important to realize the impact this has on profitability. Since the beginning of October, the nearly $1.00/bushel rise in corn and $100/ton increase in soybean meal have combined to reduce margins by about $8/cwt. for Q2, even though projected margins have improved almost $9/cwt. overall since then. The increase in projected hog prices has more than offset the increase in feed costs.

While you may believe the opportunity to the upside for hogs outweighs the risk to the downside, it may be prudent to protect forward profitability, particularly in deferred periods where margins could end up being weaker than current projections. Q3 2022 hog margins are currently just below $20/cwt., and like Q2, are in the top decile of the previous decade at the 93rd percentile of the past 10 years. While both Q4 and Q1 2023 margins are comparatively weaker from a historical perspective, they are nonetheless above average and close to the 80th percentile of the previous decade. Moreover, we are moving into a seasonal period where it has historically been beneficial to protect winter margins as they tend to peak during the spring.

While feed costs are already quite high, a further rise in prices could pressure forward profitability during a period when it may be more difficult for hog and pork prices to keep pace. The recent Russian invasion of Ukraine adds a whole new risk dimension to the global supply/demand outlook. The slowing of Ukrainian corn flow is a major potential issue in a tightening global balance sheet situation. Tension in the Black Sea region introduced new volatility to the market over the past several weeks.
While there are a multitude of knock-on effects from the escalation, the corn market has been particularly impacted. According to the latest WASDE report, USDA projects Ukraine to account for 17 percent of global corn exports. Ukraine on February 24 suspended commercial shipping at its ports after Russian forces invaded the country. While it is unclear the impact this will have long term on the Eastern European country’s ability to supply grain to the world, futures markets were limit up in the immediate aftermath of the invasion.


Moreover, the major corn and soybean exporter stocks to use ratios are historically low, and this magnifies the risk from uncertainty in the aftermath of Ukraine’s situation. Major corn exporter stock-to-use for the 21/22 crop year of 8.4 percent in the latest WASDE is well-below the average over the past decade. It is important to note this figure accounts for record corn production in both Argentina and Brazil, where La Nina has significantly impacted crop planting and conditions. Most analysts expect the South American crop to continue shrinking, putting further pressure on an already tighter-than-average global balance sheet.

Likewise, the global soybean balance sheet is also historically tight. USDA last projected the major soybean exporter stock-to-use ratio at 16.8 percent. If realized, this would be the lowest level since 1996. Similar to corn, USDA has been shrinking South American soybean production in each of the last two WASDE reports. Crop conditions in both Brazil and Argentina continue to struggle, opening the door for a continued tightening of the global balance sheet.

The fertilizer market is another risk factor for corn which could significantly impact the domestic supply/demand balance sheet for the upcoming crop year, particularly if the weather is unfavorable during the planting and growing season. Russia is the second largest nitrogenous fertilizer exporter to the US and nitrogenous is the second most imported type of fertilizer. Corn typically requires applications of all three nutrients (Nitrogenous, Phosphatic, Potassic), while soybeans typically only need Phosphatic and Potassic. If the Russia/Ukraine conflict leads to lower supply/higher priced Nitrogenous fertilizer, there could be more incentive to either plant soybeans over corn or use less fertilizer on the corn which would decrease yields and production.
The US imports approximately 27% of the domestic nitrogen supply, with imports sourced from Canada (19%), Russia (18%), Qatar (14%), and Trinidad and Tobago (10%). Russia recently set 6-month quotas on phosphate fertilizers, further stressing the global market. Russia accounted for 10% of global processed phosphate exports in 2020. Potassium is also important for corn growth as it aids in disease resistance and water stress tolerance. The US imports the vast majority of its potash consumption annually with imports sourced from Canada (85%), Belarus (6%) and Russia (6%).


The USDA’s Outlook Forum recently estimated 2022/23 US corn ending stocks at 1.965 billion bushels, up 425 million from this year with a stocks/use ratio at 13.2% which if realized would be the highest since the 2019/20 crop year. The projected season-ending corn price received by producers was forecast down 45 cents from the current year to $5.00/bushel. Obviously, there are a lot of assumptions in this forecast including trendline yields and normal growing conditions. The good news is that despite currently high feed prices there are margin opportunities, and it may be prudent to take advantage of these opportunities including the protection of feed input costs.
To take advantage of opportunities, it is important to know where your margins are. By taking account of your various input costs and expenses and projecting hog sales revenue against those, you can begin tracking forward profitability and put that into a historical context. This will allow you to objectively determine favorable opportunities to initiate margin protection and shield your operation from either rising feed costs or declining hog prices. While no one can know for certain what the markets will do as we move forward in time, it is probably safe to say that we can expect more volatility given increased uncertainties.
Trading futures and options carries a risk of loss. Past performance is not indicative of future results. Insurance coverage cannot be bound or changed via phone or email. CIH is an equal opportunity employer and provider. © CIH. All rights reserved.
Most growers are probably reluctant sellers of new-crop corn in the current market for a variety of reasons. First, with old-crop corn trading at life-of-contract highs, whatever previous sales they had on bushels already relinquished were done at worse prices than now exist in the open market. Second, current spot prices are also at a significant premium to new-crop values, with an approximate 75-cent inverse between May and December futures. Many may feel that new-crop corn is therefore “undervalued” and does not adequately reflect what corn should be worth come harvest. Moreover, the inverse should close at some point with new-crop prices rising to meet old-crop price levels.
Over the previous 25 years, there have only been 5 others besides 2021 when this type of inverse has existed as of early April: 2013, 2012, 2011, 1997, and 1996. It is instructive to compare these “analog” years historically to determine whether selling December corn futures into a seasonal spring/summer rally has been beneficial to the grower versus staying open to the market into the harvest period.
Looking over this history that extends back to 1996, we can examine the seasonal tendency of December corn futures; or rather, at what time(s) of year generally does the contract tend to record its highest price? This history reveals that December corn futures generally peak by now, or by sometime in mid-June (Figure 1).
This suggests that savvy marketers should probably be prepared with some type of plan to scale into sales over the next several weeks. Obviously, there are risks that prices this year may behave counter-seasonally and possibly peak later in the summer or potentially not until the harvest period. There is one example in this history of analog years that is interesting where such a risk may play out in the current year.
Figure 1. December Corn Futures Seasonal Chart (1985-2020):

The analog years span a wide history, with three recent examples and two during the pre-ethanol era when corn prices were trading at much lower levels than what is the case now. Price peaks for December corn futures came as early as March 27 during 1997 (the 1996-97 crop marketing year), and as late as August 30 in 2011.
In one year, the low for December corn futures on June 15th preceded the high for the contract that year on August 21st. This was the infamous drought year of 2012 when a 60-year event across the Corn Belt shrank national corn yields to 123 bushels/acre and sent the domestic stocks/use ratio down to 7.4% vs. the 10.2% projected this year. Not only did the high come later that particular year, but harvest prices were over $7.00/bushel and considerably higher than where spring prices that year were trading in the low to mid-$5.00 range.
Figure 2 shows a table of these 5 analog years, with the inverse between May and December corn futures as of the beginning of April noted along with highs, lows, and dates of the December corn futures contract for comparison. The 2012 year is indicated with an asterisk to reflect the one year where a marketing strategy based on a seasonally scaled-in selling approach was disadvantageous to the grower by harvest time and expiration of the contract.
Figure 2. Comparison of Analog Years for the December Corn Futures Contract:

Inverted Corn Markets are Not Predictive
While most growers will naturally be reluctant to sell forward new-crop bushels this season, there are compelling reasons to consider doing so. While prospective acreage based on the USDA’s preliminary report is below market expectations and only marginally above last year, that may yet change by the final figure in late June. Moreover, a fast start to planting this season may also encourage additional corn acreage that may not have been intended.
In addition, much of the bullish fundamental outlook is predicated on the continuation of strong demand, particularly from China. Given recent news of new ASF variants taking out around 9 million sows, forward demand is questionable despite clear intentions and incentives to rebuild the herd there. Also, high prices are likely to encourage additional corn acreage outside of the U.S., and the world supply/demand balance is not as historically tight relative to the U.S.
In conclusion, there is strong historical evidence that selling into this type of market structure has been beneficial based on past analog years. Moreover, inverted markets are not predictive of future price direction. It is not true that forward prices will always rise to meet spot values. Unless there is a widespread drought this summer, it may be difficult for corn futures to push significantly higher from current levels, particularly given the degree of fund length already in the current market.
As a result, it may be the case this year that adhering to a disciplined, normal schedule of progressively scaling into new-crop corn sales over the spring and summer will prove beneficial by harvest this fall. While most growers will likely be bullish, new-crop marketing plans might be a timely thing to prepare as we move further into the spring.
For more help on initiating marketing strategies or to review your own strategies, please feel free to contact us.
There is a risk of loss in futures trading. Past performance is not indicative of future results.