
One of the main economic functions of the futures market is price discovery. Participants from all over the world place bids and make offers in a dynamic auction to determine the value of a commodity or financial instrument at any given point in time. Because multiple contracts trade simultaneously for the same commodity in different time periods, both nearby as well as in deferred months and years, this price discovery process is multi-dimensional. It not only reveals the current or “spot” value but also expectations about how that value will change over time. Studying this relationship, referred to as the forward curve, can provide valuable information on how market participants anticipate future price movements for the cash market. It also can help hedgers refine position structure to protect risk in deferred time periods.
The Cash and Futures Relationship
Futures contracts are called derivatives because they derive their value from the underlying cash market. Based on the contract specifications, futures either settle to the cash market through physical delivery as is the case with contracts like corn, or are cash settled where their final value at expiration is determined by some sort of an index as is the case with hogs. In either case, prior to a contract’s expiration and convergence with the cash market, there is a difference in value between the spot cash price and the nearby futures price. This difference, or basis, changes over time where in some cases the cash price may be at a premium to futures, and in others a discount.
Looking beyond the nearby futures contract, deferred futures also may be trading at premiums or discounts to the cash market as well as to nearby futures. One of the reasons why deferred futures prices may trade at a premium to spot prices could be seasonality. For many commodities, there is a normal tendency for prices at certain times of the year to be higher or lower than other times of the year, and the futures curve reflects those seasonal tendencies. Another reason may be fundamental. As an example, there may be a shortage of the commodity in the spot market although the pipeline might suggest ample supply in a deferred period. In such a case, the spot or cash price would be trading at a premium to forward futures prices.
The Hog Market
The current structure of the hog market offers one example of the relationship between cash prices and the forward futures curve. Notwithstanding a recent recovery, the cash hog market has been under heavy pressure since late January as supplies have been larger than expected. After starting the year at prices very close to the average of the past 10 years, the CME Lean Hog index declined almost $22/cwt. between late January and early April as hog slaughter and pork production have posted strong year over year increases from 2017 (see Figure 1). Total hog slaughter during Q1 was 31.075 million head, up 3% from a year ago; however, pork production of 6.645 billion pounds during the quarter was 3.7% higher than last year as hogs are coming to market at heavier weights.
Moreover, the latest USDA Hogs and Pigs report indicated that supply growth is likely to continue through the summer and into fall. The hog breeding herd on March 1 was estimated at 6.2 million head, the largest since 2008 with producers reporting that they intend to farrow more sows than a year ago for the next two quarters. March-May farrowing intentions were up 2.1% from 2017 while the June-August quarter showed an increase of 1.4% from last year. Recent news of China’s decision to impose retaliatory tariffs on U.S. pork imports hasn’t been helpful either as much of the offal goes to that market with limited opportunities for other outlets.
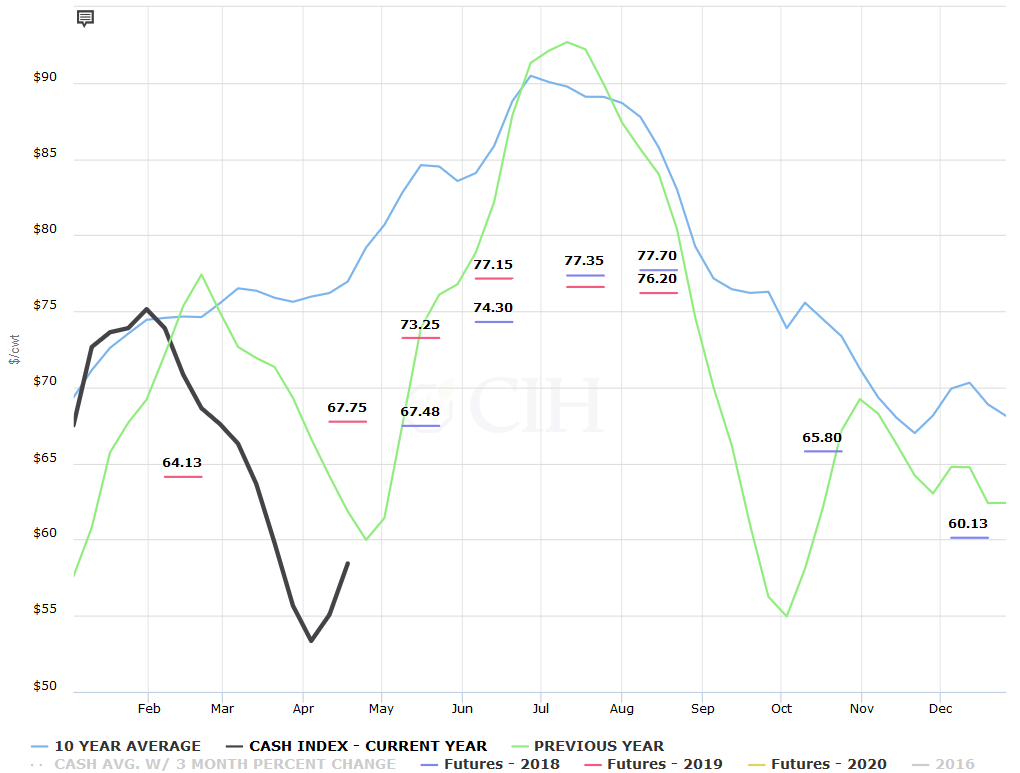
Looking at Figure 1, you will notice that the loss in value in the CME Cash Hog Index and subsequent recovery was very similar to last year (green line) albeit around 3 weeks early in 2018. You will also notice the hash marks spread across the page, which represent futures prices as of April 26. The blue lines correspond to 2018 futures while the red lines are the values for futures in 2019. Each value is displayed in the middle of the month when the futures contract expires. The 67.48 value in blue between the month of May and June represents the current value of May 2018 futures which is where the black line is headed over the next few weeks. Given the two values have to converge at expiration, this means that either the black line (spot cash market) needs to rise further, and/or the price of May futures needs to come down in order for the two to converge by mid-May.
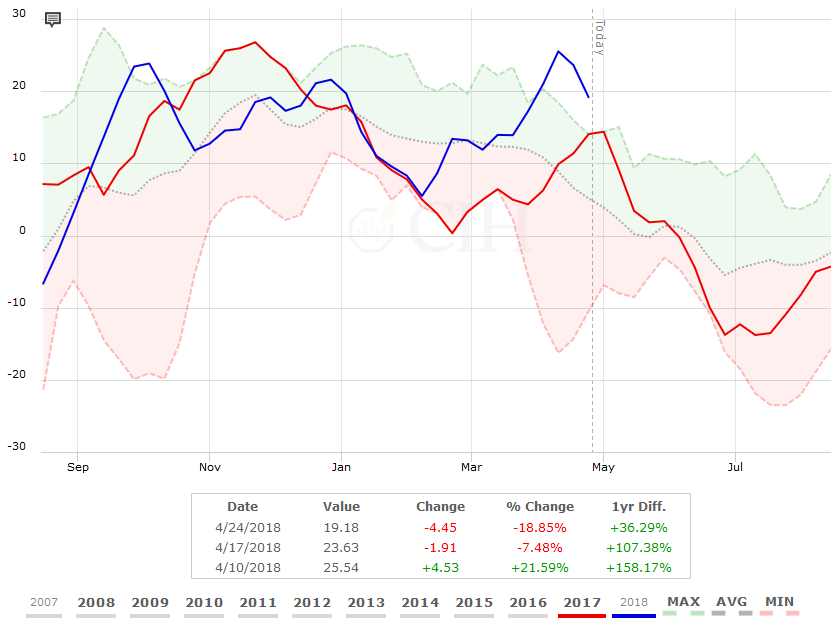
The summer futures prices with June at 74.30, July at 77.35, and August at 77.70 indicate expectations for a continued rise in the cash market or CME Lean Hog Index over the next few months as would seasonally be expected, although those expectations are much more muted than the increase in cash prices we witnessed last year when looking at the green line. This likely is due to the factors previously mentioned with larger hog slaughter and pork production relative to last year and increased trade uncertainties. From a hedging perspective, while the futures market represents a fair estimate of value for summer hogs based on what is currently known, it may make sense for a producer to retain upside flexibility on their price hedges in case the cash hog market is stronger over the next few months. As a counterpoint however, it should be noted that August Lean Hog futures are also currently trading at their highest premium relative to the CME Lean Hog Index in the past decade (see Figure 2).
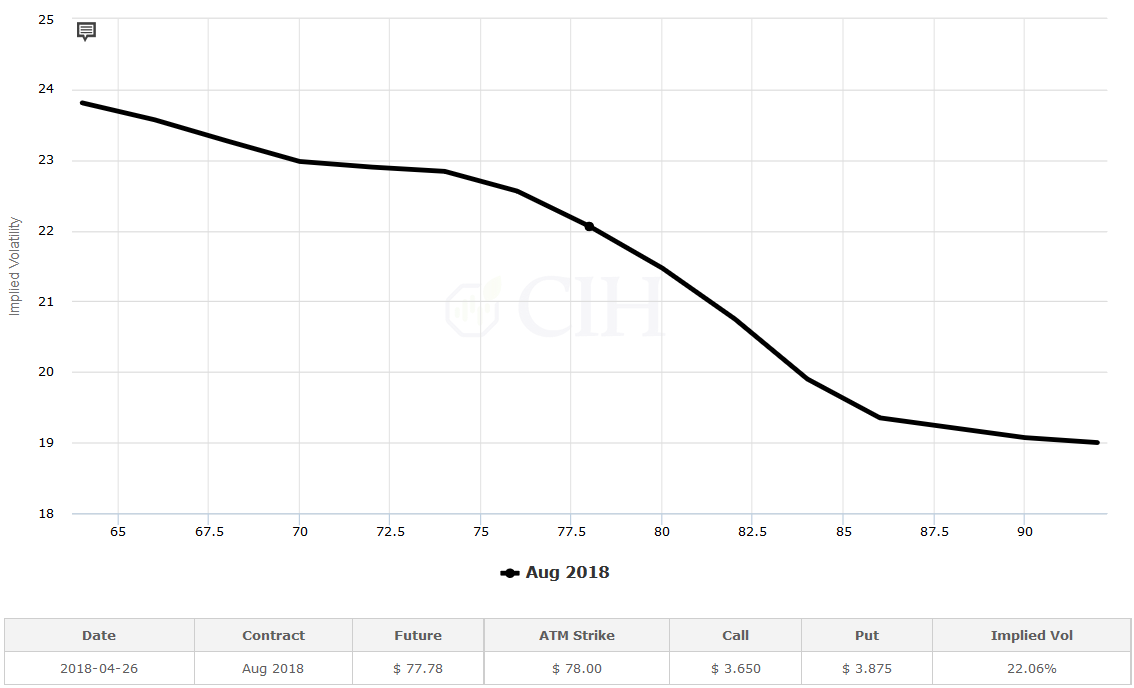
An example of how a producer might address both of these considerations in a hedge would be adding long call options to a short futures hedge or cash sale in the local market against their summer marketings. The August futures are trading around 77.70, so the producer might purchase a call option with an $80 or $82 strike price to address the opportunity cost in a higher market against pre-existing sales either in the cash market or on the board. They may even choose to offset part of the cost of purchasing the call by selling put options below the market. This not only would lower the cost of adding upside flexibility to the hedge, but also take advantage of the current option volatility skew in the market as higher strike calls are trading at lower implied volatilities relative to lower strike puts (see Figure 3).
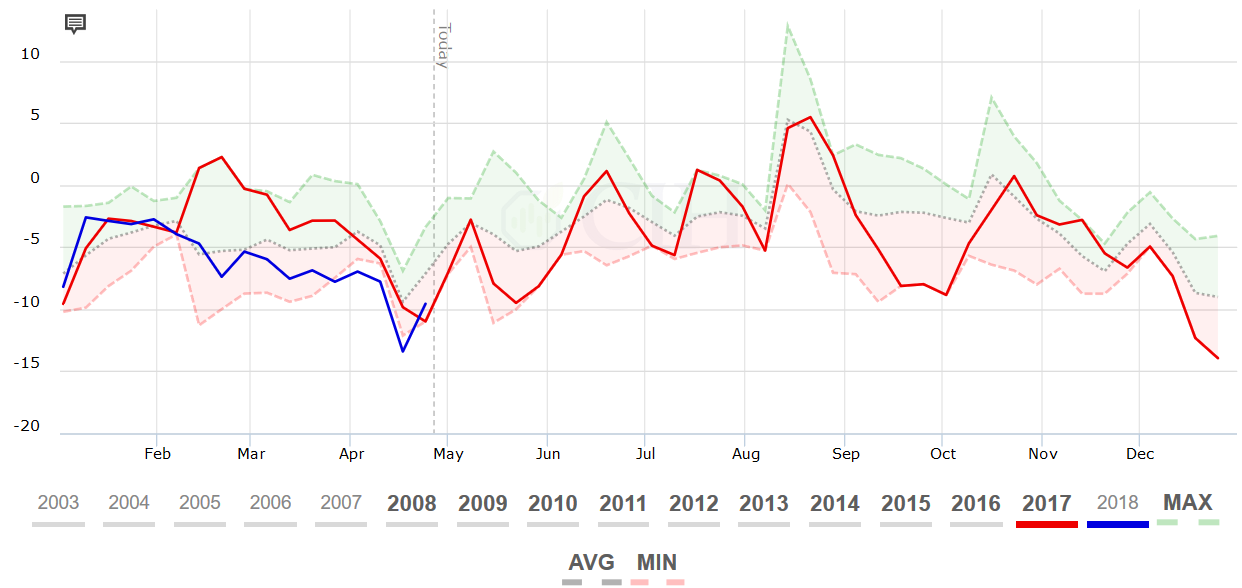
Another consideration for a hog producer from a hedging perspective concerns cash basis levels. With the cash market trading at a discount to futures, hog basis is currently negative and has actually been running at or near new 10-year lows through the month of April (see Figure 4). Because of this, a producer would only want to deliver hogs against the minimum amount necessary to meet packer commitments, and possibly even slow down hedge removals against their marketing schedule.
The Cattle Market
By contrast, the forward curve in cattle offers a different perspective on the relationship between cash and futures prices as well as the implication for hedgers. Unlike the hog market where cash prices are currently trading at a discount to futures, spot cattle prices in the cash market are at a premium to the forward curve. Despite the fact that the number of cattle on feed as a percentage of the previous year has consistently run 107%-109% over the past several months, much of the cattle placed into feedlots last fall were lighter weight animals that require more days on feed to reach market weight. As a result, cattle marketings and slaughter have not kept up with demand as packers have large commitments they need to fill in the spot market.
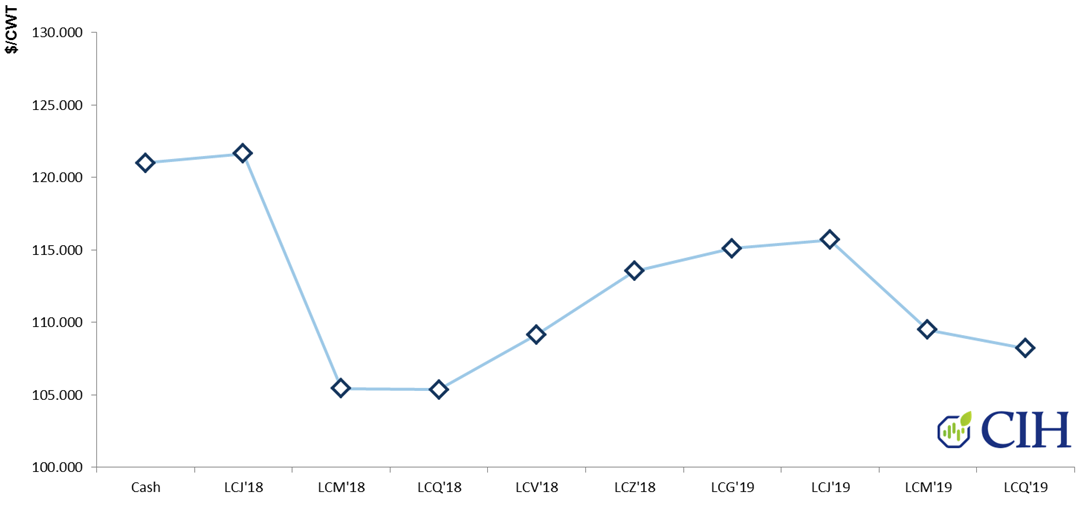
Because of the heavier placements over the past several months however, expectations are that an abundant supply of cattle will be available to the market during the summer marketing period. Since market participants anticipate this increased supply of cattle and beef production over the next several months, the forward curve reflects these expectations with lower prices for summer contracts relative to the spot spring period. Prices are gradually expected to increase heading into the fall and winter from a summer low against the June and August contracts. Figure 5 shows the forward cattle curve out through August, 2019:
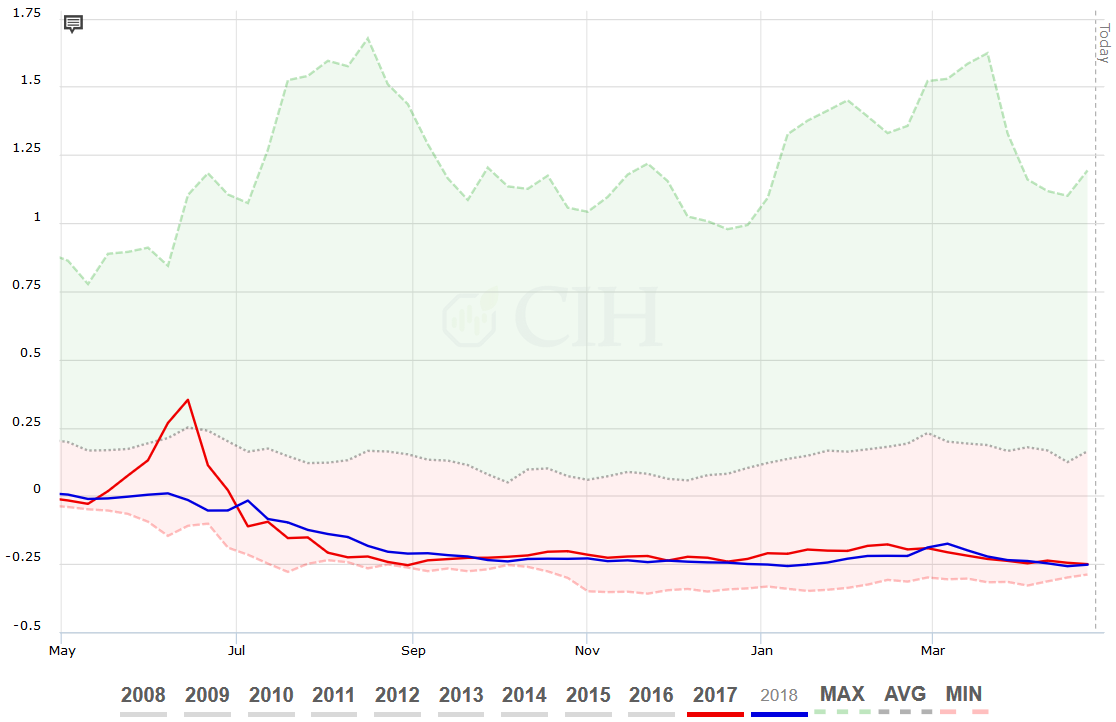
Compared to the hog market, the relationship between cash cattle and forward futures implies a much different scenario for cattle producers in managing their inventory and hedge positions. Unlike hogs, the basis has been strong for cattle. Figure 6 displays the current cash basis for live cattle in the Texas, Oklahoma, and New Mexico region, which has been running at or near 10-year highs over the past month. The historically strong cash basis which is well above average provides a strong incentive for producers to market early and pull supplies forward, hopefully alleviating the possibility of excess supply later in the summer.

Meanwhile, because the forward curve is discounted relative to spot futures and the cash market, a cattle feeder would also be encouraged to maintain upside flexibility in their hedges against summer marketings. Similar to hogs, a cattle feeder might likewise consider adding long call options to a short futures position. Alternatively, they may choose to protect downside price risk on their physical inventory by simply purchasing put options. Depending on their projected breakeven levels, they could finance the purchase of puts by selling upside calls to establish a maximum price on a portion of their inventory.
The Corn Market
Another example of the relationship between the cash market and the forward futures curve is the corn market. After harvesting another bumper crop last fall on record yields that maintained corn stocks at historically high levels, cash corn prices have been depressed with limited expectations for much of a recovery. Recent drought conditions in Argentina however and lower than expected intended acreage revealed in USDA’s Prospective Plantings report has put some risk premium back into the market. In addition, cold and wet weather which has extended through April across much of the Northern Corn Belt has delayed planting progress and likewise added a risk premium to the futures market.
Unlike hogs or cattle, corn is a storable commodity and the relationship between prices of futures contracts on the forward curve typically reflects a “cost of carry” or storage between delivery months. In a situation like the present where supplies are plentiful, there will be a positive carry such that deferred futures are trading at a premium to nearby futures, reflecting the cost of storing the crop between expirations. In a case where there is a shortage, such as in a drought like the 2012-13 crop year, there will be a negative carry or a premium on nearby futures relative to deferred futures contracts. This provides a disincentive for producers to hold on to their crop as they effectively lose money storing between expirations. Figure 7 displays the current forward curve for corn:

For a corn producer, the forward curve on corn implies different considerations for managing hedge positions between old-crop corn in the bin and new-crop corn which is now being planted. Looking at the first half of the curve representing the 2017-18 old-crop marketing year, there is a positive carry as previously mentioned. In other words, the producer is incentivized to hold on to their crop in order to capture the carry in the market. Assuming the producer has storage, they therefore would want to maintain a short hedge in the deferred July or even September futures contract against their physical inventory, representing the horizon of the old-crop price curve.
Another way of looking at this would be to analyze the spread between old-crop and new-crop corn within a historical context. Figure 8 shows the spread between the spot May Corn futures contract and the new-crop December futures contract. You will notice that the 25-cent discount of May relative to December is the same as last year and near a 10-year low for this time of year.
Looking out to new-crop however, the forward curve is telling us something different. Given the previously mentioned dynamics of lower intended acreage and delayed planting progress that has been compounded by the crop losses in Argentina, the second half of the forward curve starting with the new-crop December contract is relatively flat. This is because a majority of the open interest or price discovery in new-crop corn is in the December futures contract, which has been bid relative to the forward contracts on the curve. While the March, May, and July 2019 futures contracts are trading at successive premiums to December 2018 futures, these premiums are relatively small from a historical perspective.
If we look at a similar chart to Figure 8 which now compares the December 2018 futures price relative to the July 2019 futures price, you will notice in Figure 9 that the 16 cent discount of December futures relative to July for new-crop corn is at a 10-year high for this point in the season. As a result, unlike in old-crop where a corn producer would be incentivized to place their short hedge as far out as possible on the curve; in new-crop, there is an incentive to keep the short hedge on the front end of the curve in the December contract, and wait for more carry to be built into new-crop spreads.
The forward curve is an important component of the price discovery process in the futures market and provides valuable information for a risk manager to consider when evaluating their exposure. Understanding the relationship between cash and futures can help producers better manage their hedge positions and leverage the information being provided by the market to take advantage of opportunities that may present themselves.
There is a risk of loss in futures trading. Past performance is not indicative of future results.